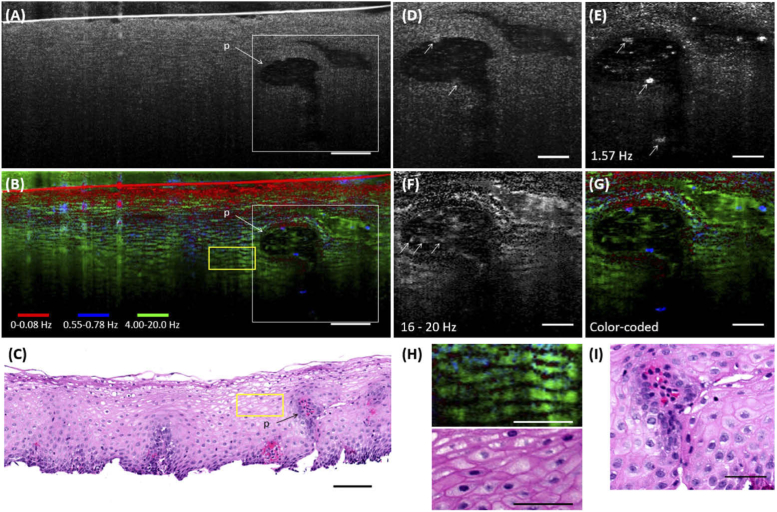
Fig. 3.
Images from a human esophageal biopsy. (A) A 200-frame averaged µOCT image of the biopsy. (B) d-µOCT color-coded image. (C) Corresponding H&E stained histology of the sample. (D to G) Enlarged views of the papilla outlined in white in (A) and (B). (D) is a standard µOCT image of the papilla. (E) and (F) are d-µOCT images of the papilla at 1.57 Hz and 16-20 Hz, respectively. (G) is a d-µOCT pseudo-colored composite image of the papilla. (H) Magnified portions of the yellow ROIs in (B) and (C). (I) is a histology image of the papilla. p: papilla. d-µOCT color codes: Red 0-0.08 Hz, Blue 0.55-0.78 Hz, Green 4.00-20.0 Hz. Bars in (A) to (C) = 100 µm. Bars in (D) to (I) = 50 µm.

