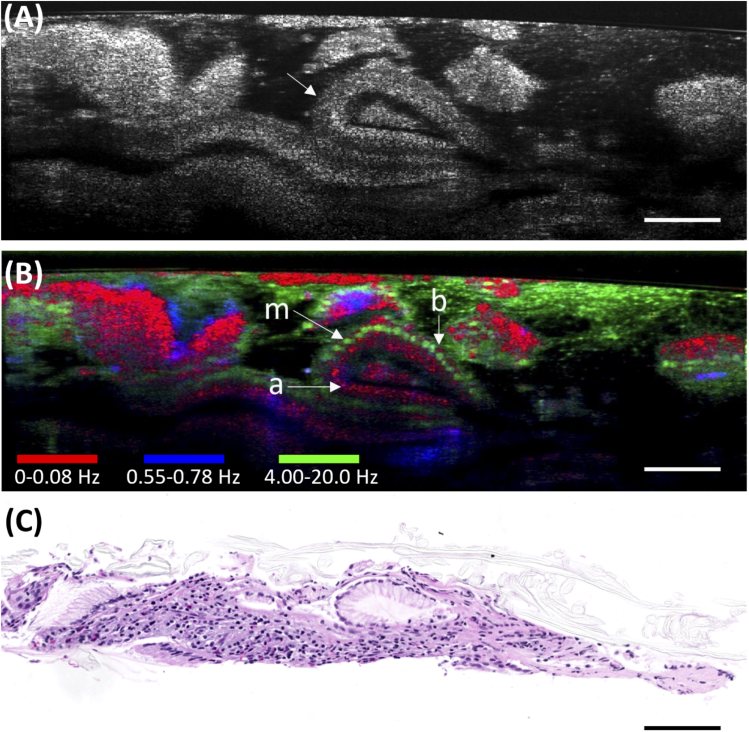
Fig. 4.
Images of a biopsy from a human gastroesophageal junction. (A) A 200-frame averaged µOCT image of the biopsy showing columnar glandular architecture (arrow). (B) Color-coded d-µOCT image demonstrating glands containing cells with low frequency regions at their base (b), high-frequency modulation in the middle (m), and low frequency apically (a). (C) A comparison with the histology of the biopsy showing mucous cells. d-µOCT color codes: Red 0-0.08 Hz, Blue 0.55-0.78 Hz, Green 4.00-20.0 Hz. Bars = 100 µm.

