Fig. 7.
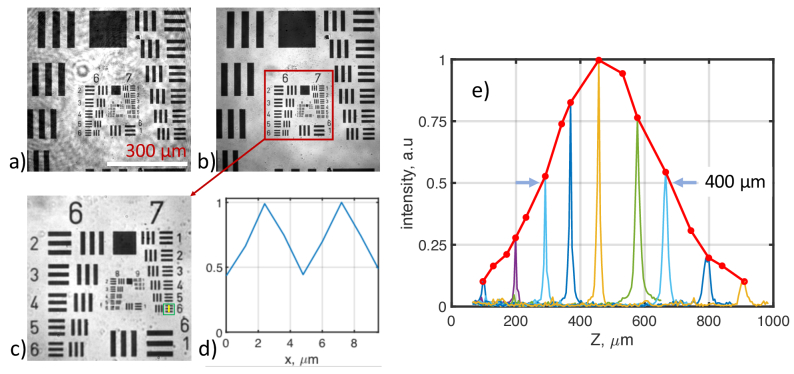
System characterization. FF-OCT images of USAF target as imaged with (a) a coherent laser beam (DM OFF) and (b) incoherent beam (DM ON). Zoomed-in FF-OCT image (c) shows that element # 6 of group #7 (green square) can be resolved, as confirmed by the line profile (d) that was taken along the yellow line in (c). (e) temporal and spatial coherence gating curves representing the OCT signal as a function of the sample’s defocus.

