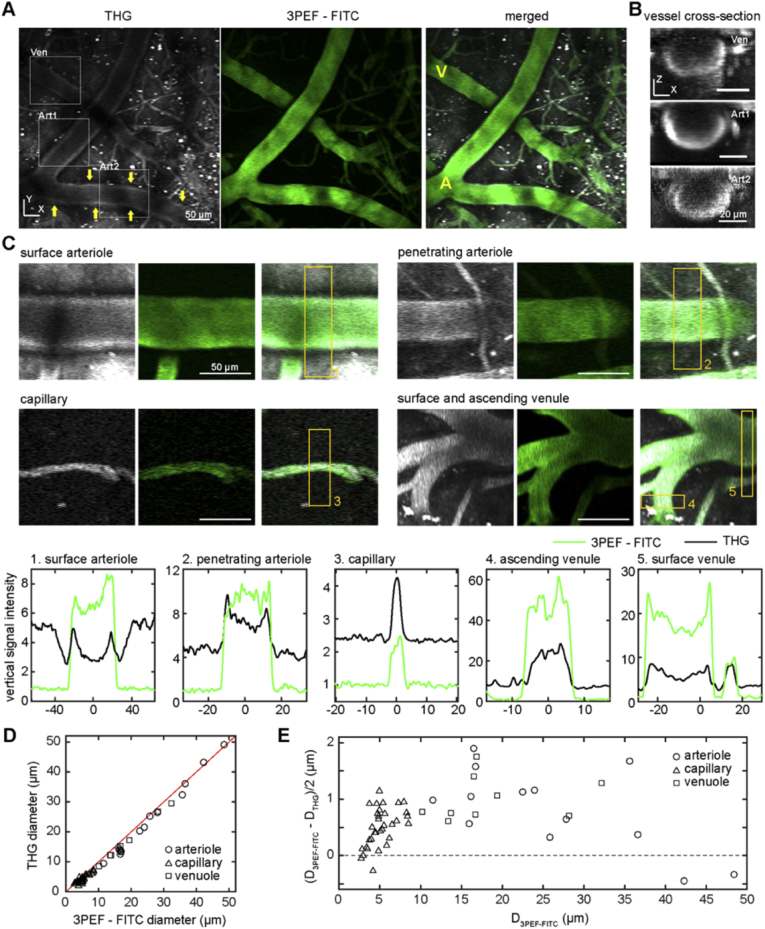
Fig. 1.
Imaging of RBCs using THG highlighted blood vessels and, when combined with 3PEF of intravascular FITC, enabled measurement of the CFL thickness. (A) Average projections of 30-µm deep image stack using THG (left, greyscale), 3PEF of intravascular FITC-dextran (middle, green), and the merged images (right) taken from the cortical surface in the XY plane in a live, anesthetized mouse. The yellow A and V in the merged image label an arteriole and venule, respectively. Yellow arrows in the THG image point to THG signal arising from the vessel wall of an arteriole. Boxes identify vessels shown in XZ projections (B) from venules (Ven) and arterioles (Art1 and Art2, respectively). The XZ projections were projected along the axis of the vessel. (C) Average projections of THG (left, greyscale), 3PEF-FITC (middle, green), and merged (right) from different classes of surface and sub-surface blood vessels. Projections were from just above to just below each vessel. The plots (below) show the transverse intensity profiles for the THG (black) and 3PEF-FITC (green) signals, taken at the location of the correspondingly numbered yellow rectangles in the images. (D) Plot of the full width at half maximum (FWHM) of the THG signal (THG diameter, DTHG) versus the FWHM of 3PEF-FITC signal (vessel diameter, D3PEF-FITC) for all vessels measured, distinguishing arterioles, capillaries, and venules (n=52 vessels across 4 mice). (E) Cell free layer thickness, defined as half the difference between the 3PEF-FITC diameter and the THG diameter, for all vessels measured plotted as a function of vessel diameter. Scale bar in A and B is 50 µm.

