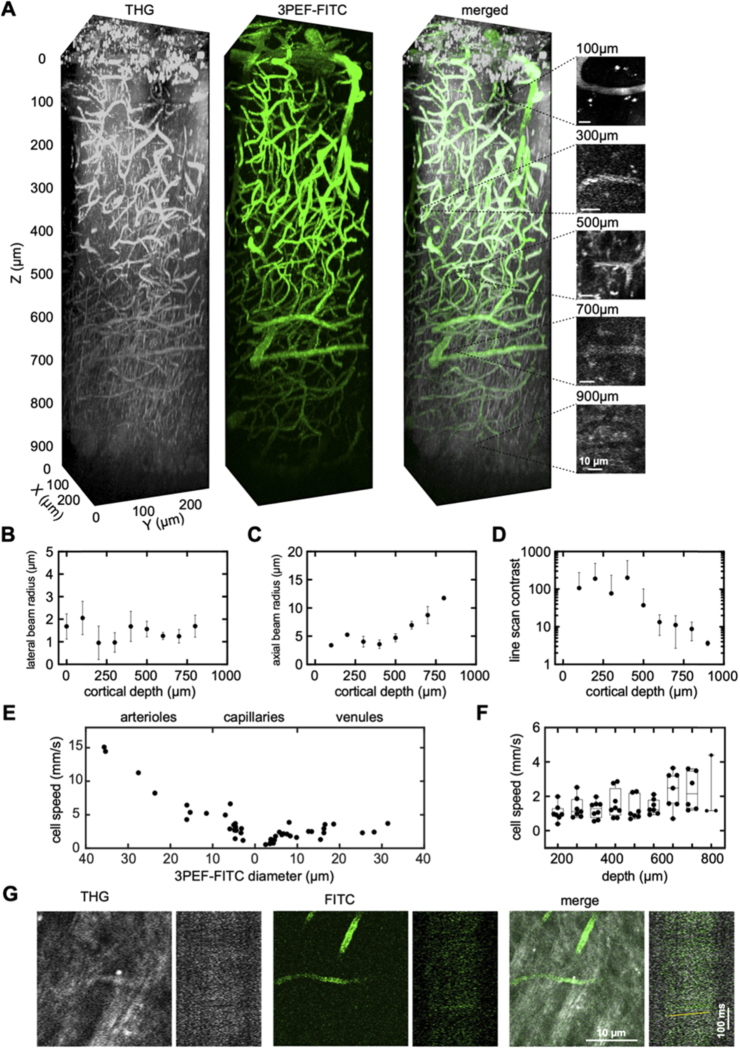
Fig. 2.
THG imaging of RBC motion enabled quantification of blood flow speed in vessels from the brain surface to the white matter. (A) 3D renderings of image stacks taken to a depth of 1 mm into the cortex of a live, anesthetized mouse using THG (left, greyscale), 3PEF-FITC (middle, green), and merged (right). The small images on the right show representative capillaries at different depths together with space-time images of line scan data, both using THG. (B) Lateral and (C) axial 1/e beam radius, measured by fitting an error function to the rise in 3PEF-FITC signal at the edge of a vessel, shown as a function of depth below the cortical surface. Three capillaries were measured at each depth. Error bars show the SD. (D) Average contrast of the capillary line scans, defined as the difference in brightness of the brightest and dimmest 10% of pixels, plotted as function of depth, showing mean and SD (n=70 capillaries from 4 mice; contrast was measured in some deep vessels for which we were unable to extract a flow speed). (E) RBC flow speed as a function of vessel diameter from THG line scan data. Data for arterioles are displayed on the left with diameter decreasing to the right, while venules are displayed on the right with diameter increasing to the right. Capillaries are displayed toward the middle, and are located on the arteriole or venule side based on their topological proximity to the nearest penetrating arteriole or ascending venule. (F) Box plot of RBC flow speed in capillaries at different cortical depths, measured using THG line scans (e.g. images on right in A) (n=60 capillaries from 4 mice). (G) THG (left, greyscale), 3PEF-FITC (middle, green), and merged (right) average projection images and line scan data from a capillary in the corpus callosum, at a depth of 1,060 µm. The yellow line in the merged line scan indicates the angle of the streaks formed by moving RBCs. Scale bars are 10 µm (horizontal) and 100 ms (vertical) in both A and E.

