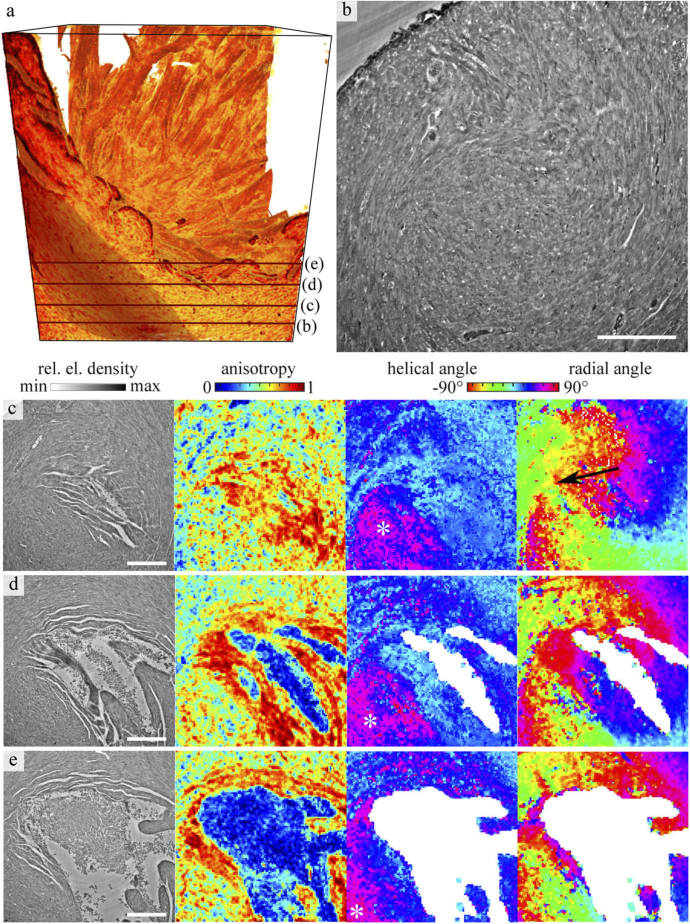
Fig. 5.
Orientation of the cardiomyocytes near the tip of the left ventricle, shown for the ethanol-embedded heart. (a) Volume rendering of the heart tissue, with (b) a representative transverse slice through the reconstructed density. The location of the slice is marked as a red line in the volume rendering. Details as small vessels and nuclei can be identified in the dense arrangement of cardiomyocytes. Further, on the left of the 3d volume one bundle of cardiomyocytes is highlighted. (c-e) Further slices through the reconstruction volume are located below the left ventricle and consecutively shown from apex upwards. For each slice, the density, anisotropy, modulus of the helical angle and radial angle are plotted. The locations of the slices are also marked as dark red line line in (a). The white asteroid in the display of the helical angle marks a muscle bundle which is oriented in the direction of the long axis. The black arrow in (c) indicates a vortex of the cardiomyocyte arrangement. Scale bar: 250 µm.

