Figure 1.
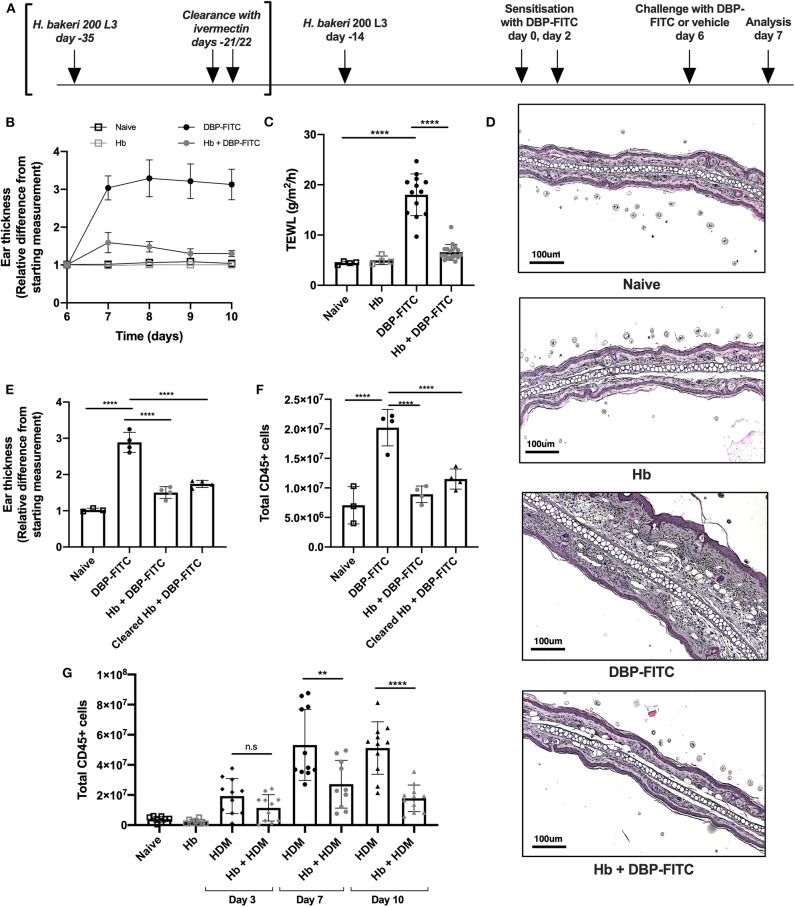
DBP-FITC-induced skin inflammation is suppressed by H. bakeri infection. (A) Timeline of Hb infection and DBP-FITC topical sensitization and challenge model. lvermectin treatment for Hb clearance experiments [results in (E,F)] is shown in brackets. (B) Relative difference in ear thickness compared to day 6 baseline measurements, in naïve mice (black lined clear squares), Hb-infected mice (gray lined clear squares) or in mice challenged DBP-FITC (gray circles) or without (black circles) prior Hb infection. (C) TEWL (g/m2/h) at site of DBP-FITC challenge measured at day 7, or in control naive mice. (D) Ear sections stained with H&E on day 7. Scale bars represent 100 um. (E) Relative difference in ear thickness in naïve mice, or at day 7 after DBP-FITC challenge in mice with Hb infection, or after clearance of the infection. (F) Total number of live CD45+ cells in ear dLN at day 7 in the same groups as (E). (G) Total number of live CD45+ cells in ear dLN at days 3, 7, and 10 post-HDM intradermal injection into the ear, with or without prior Hb infection, or in naive mice. A one-way ANOVA with Tuckey's multiple comparisons test was used to test statistical significance. Graphs represent data combined from 2 experiments (B,C,G) or are representative of 2 repeat experiments (D,E,F) and show mean ± SD. n.s, not significant; **p < 0.01, ****p < 0.0001.

