Figure 3.
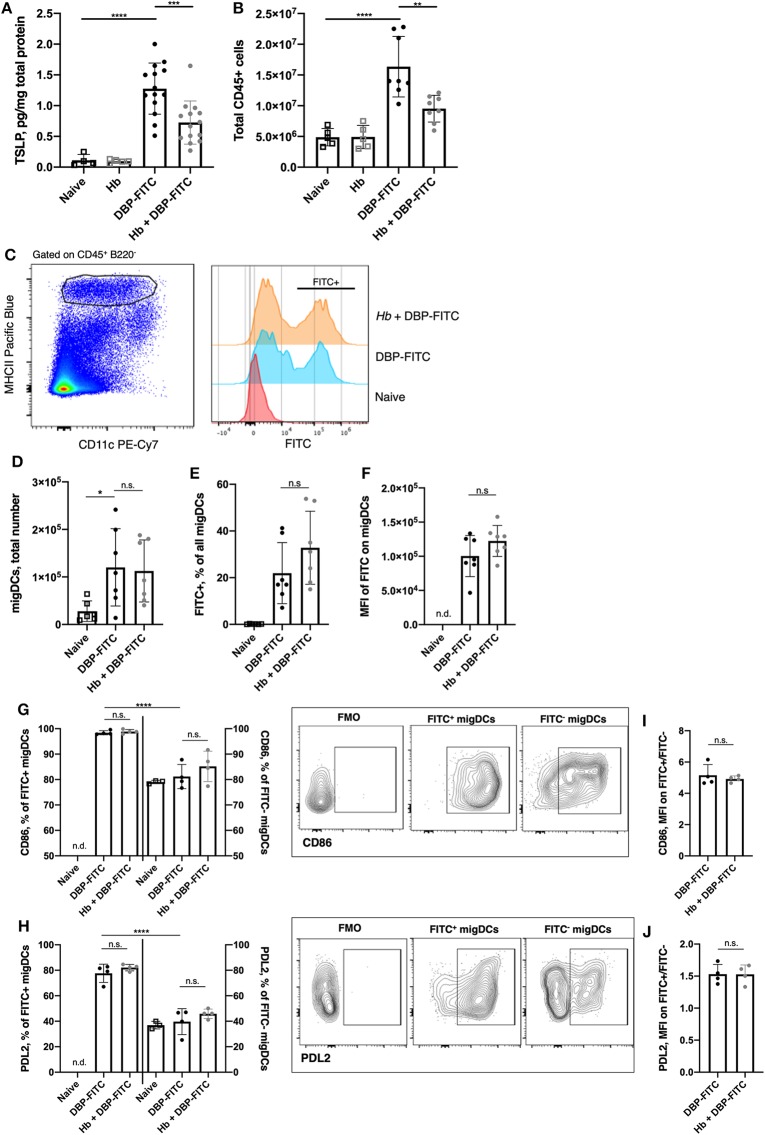
H. bakeri infection does not affect DC uptake and transport of DBP-FITC to the skin draining LN after sensitization. (A) TSLP protein levels 24 h post-sensitization with DBP-FITC in tissue lysate measured by ELISA. (B) Total number of live CD45+ cells in the ear dLN at 2 days post DBP-FITC sensitization. (C) Representative plots of FITC expression by CD45+ B220− CD11cvar MHCIIhigh migratory DCs (migDCs) in the ear dLN at day 2. (D) Total number of migratory DCs (migDCs) in the ear dLN at day 2. (E) Frequency of FITC+ migDCs in ear dLN at day 2. (F) Median fluorescence intensity (MFI) of FITC on migDCs in the ear dLN at day 2. (G) Frequency of FITC+ and FITC− DCs expressing CD86 or (H) PDL2 in the ear dLN at d2, with plots showing representative gating. (I) Ratio of MFI of CD86 or (J) PDL2 expression in FITC+ vs. FITC- migDCs in the dLN at d2. A one-way ANOVA with Tuckey's multiple comparisons test was used to test statistical significance between multiple groups (A–H), or an unpaired t-test between 2 groups (I,J). FMO, fluorescence minus one. Graphs represent data combined from 2 experiments (A–F) or are representative of 2 repeat experiments (G–J). Graphs show mean ± SD. n.s, not significant; *p < 0.05, **p < 0.01, ***p < 0.001, ****p < 0.0001. n.d, not detectable.

