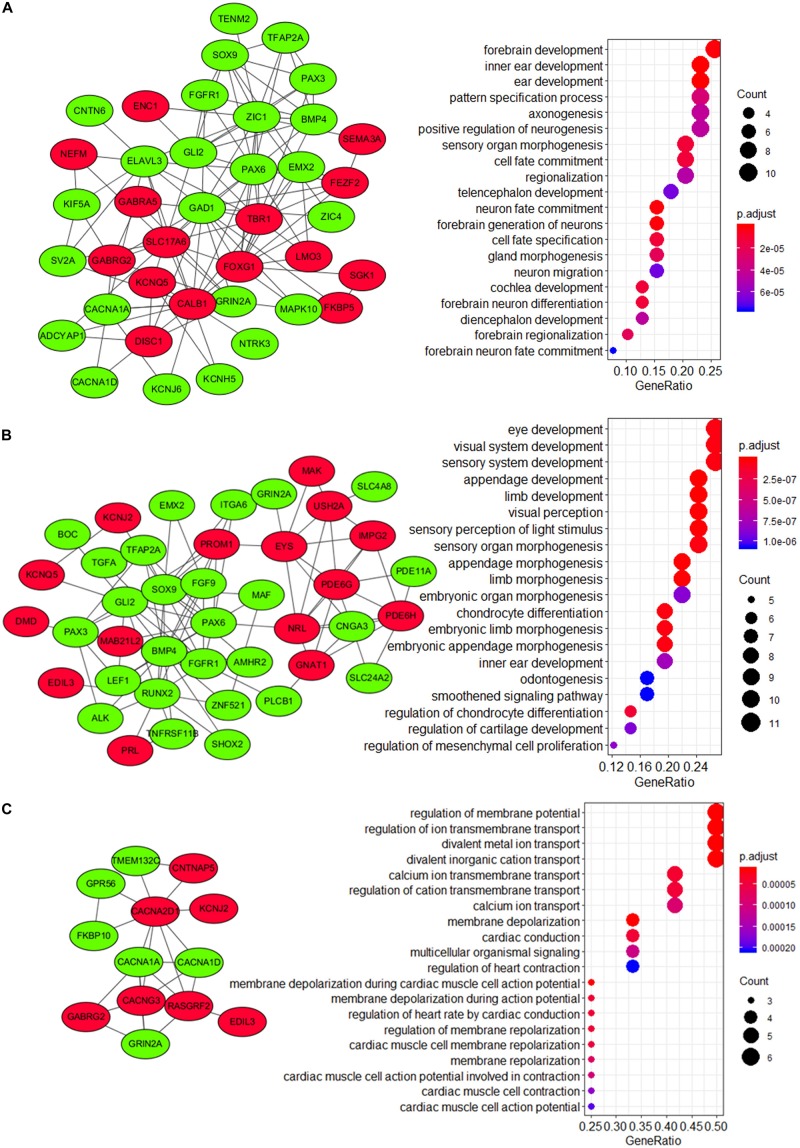
FIGURE 7.
Visualization and GO enrichment analysis of DEGs in (A) module 1, (B) module 2, and (C) module 3. DEGs that were upregulated in the high-risk group are in red nodes, whereas those that were downregulated are in green nodes. (A) DEGs in module 1 were significantly enriched in pathways that are related to CNS development, while (B) DEGs in module 2 were significantly enriched in pathways that are related to embryonic development.

