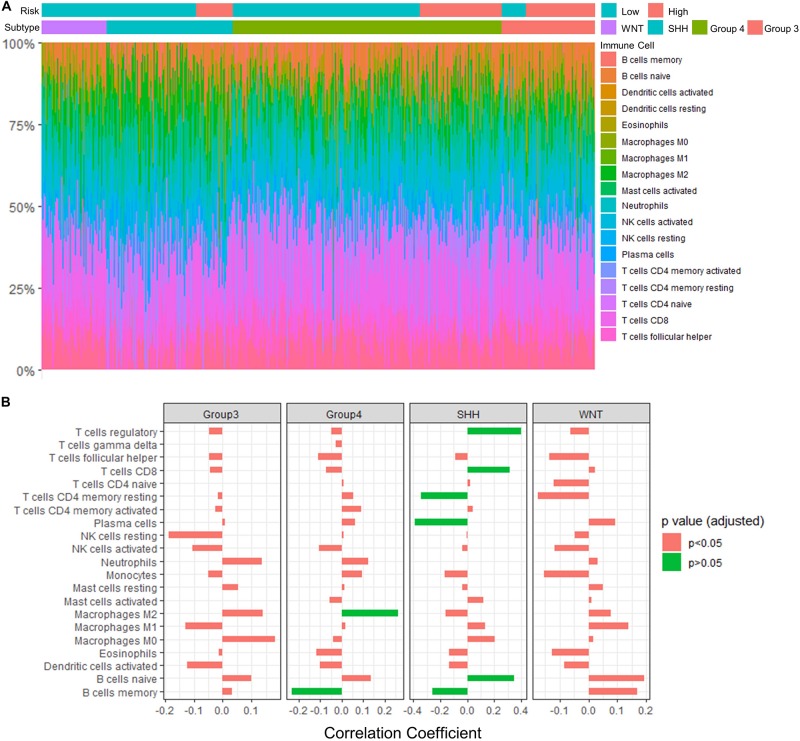
FIGURE 9.
Significant correlations between the risk score and the fraction of TIICs were found in Group 4 and SHH medulloblastomas. (A) TIICs profile in GSE85217 dataset estimated using CIBERSORTx algorithm. (B) The correlation between the risk score and the fraction of infiltrating immune cells (Spearman’s r and p. P-values were adjusted using BH method). Significant correlations are in green color.

