
Figure 2.
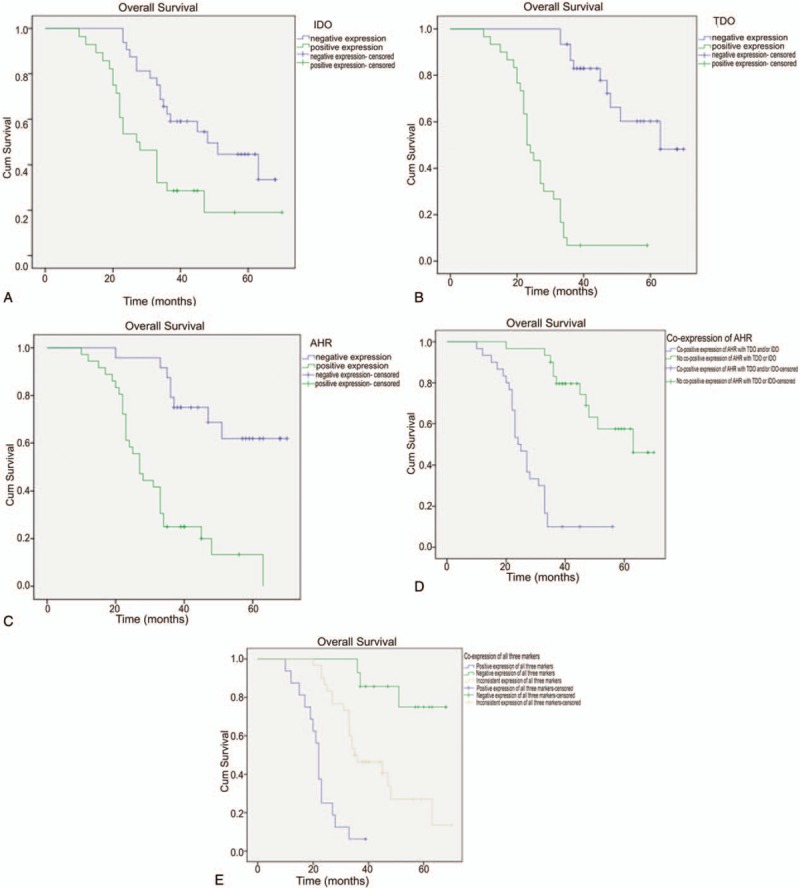
Overall survival analysis of patients positive for IDO. (A; P = .004), TDO (B; P < .001), and AHR (C; P < .001). (D) OS of patients with AHR expression combined with positive IDO and/or TDO (blue line) vs AHR expression alone (green line) (P < .001). (E) OS of patients with positive expression of all 3 markers (IDO, TDO, and AHR; blue line) vs negative expression of all 3 markers (green line) vs inconsistent expression among the 3 markers (yellow line) (P < .001).