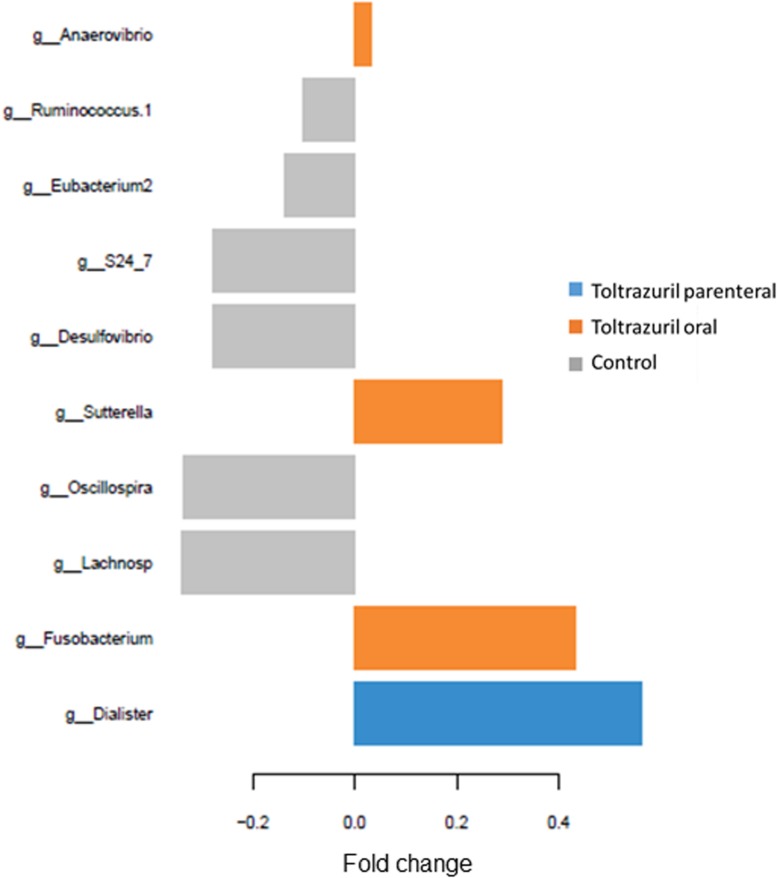
FIGURE 4.
Loading plots of sparse partial least square-discriminant analysis (sPLS-DA) showing the most discriminant bacterial genera (relative genera abundance >0.05%). Positive fold changes indicate lower abundance; negative fold changes indicate higher abundance compared to the treatment means. Comp 1; component 1 of the sPLS-DA.

