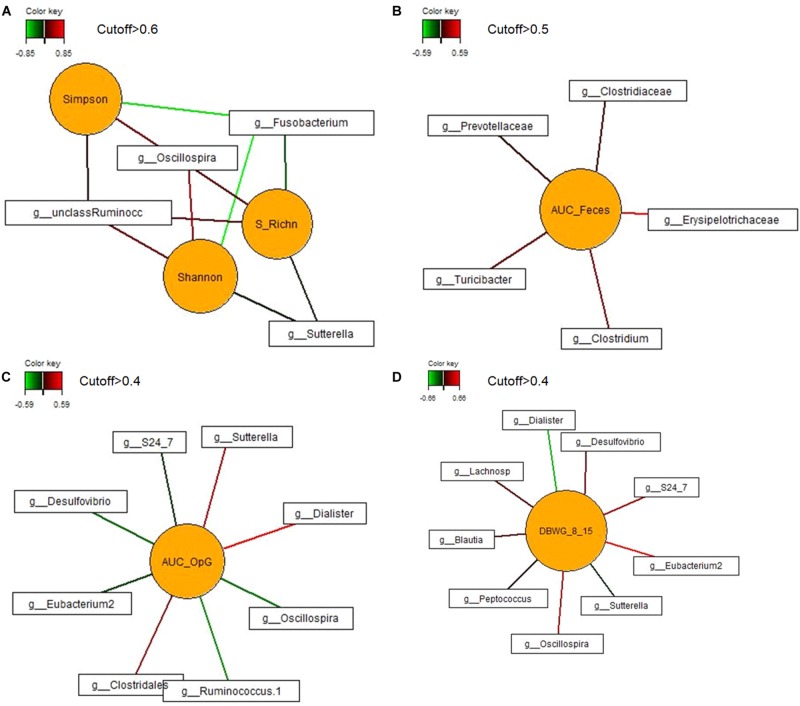
FIGURE 5.
Associations between the most discriminant bacterial genera from dol 11 and (A) α-diversity (Shannon and Simpson) and species richness (S_RichN); (B) daily body weight gain between dol 8 and 15; (C) area under the curve for the fecal score from dols 5–18 (AUC_Feces); and (D) area under the curve of the oocysts per gram of feces from dol 5 to dol 18 (AUC_OpG). For statistical calculation of AUC see Shrestha et al. (2020). Covariations between the most relevant bacterial genera (relative abundance >0.05% of all reads), diversity and species richness, DBWG, AUC_Feces and AUC_OpG were established separately using sparse partial least squares regression and relevance networking. The networks are displayed graphically as nodes (parameters) and edges (biological relationship between nodes). The edge color intensity indicates the level of association: red = positive, green = negative. Only the strongest pairwise associations were projected. Unclass Ruminoc: unclassified Ruminococcaceae genus; Lachnosp: unclassified Lachnospiraceae genus.

