
Figure 5.
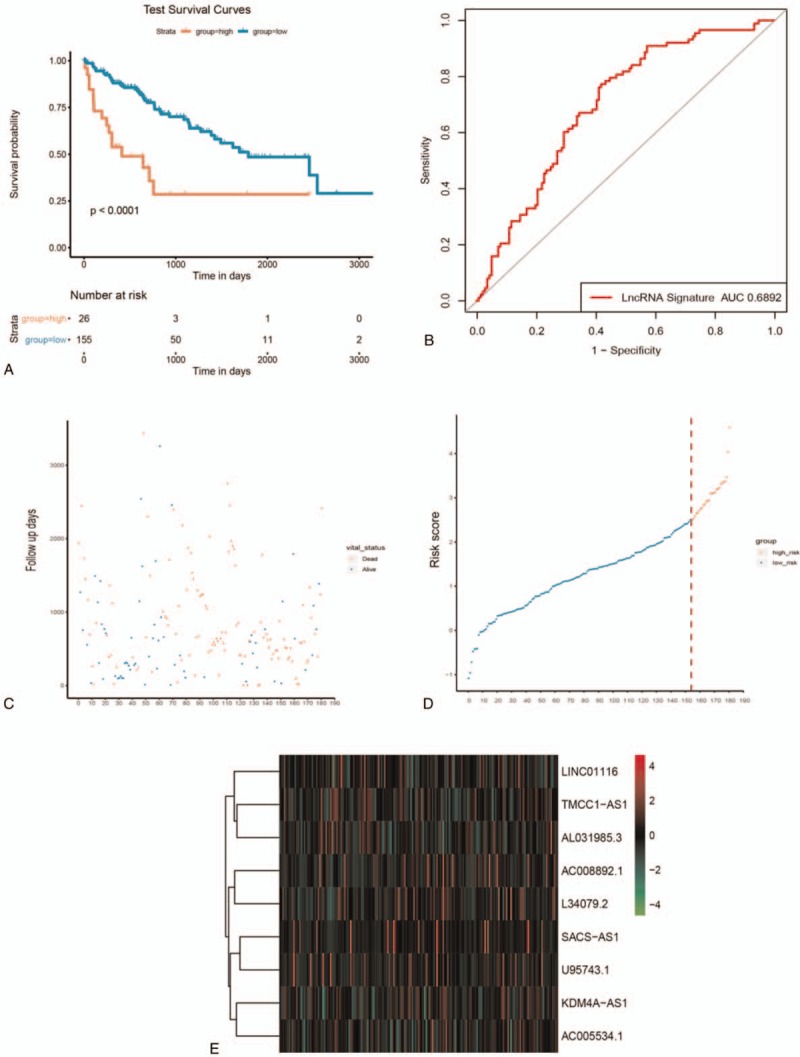
LncRNA risk score and survival analysis of HCC patients in testing dataset. A: Kaplan-Meier estimates of the patients’ survival using the 9-lncRNA signature. The Kaplan-Meier plots were used to visualize the patients’ survival probabilities for the low-risk versus high-risk group of patients based on the median risk score. B-D: the relationship between survival information, risk score, and z-score transformed expression values are shown (top-downAC008892.1, AC005534.1, SACS-AS1, U95743.1, AL031985.3, TMCC1-AS1, KDM4A-AS1, LINC0116 and L34079.2).