
Figure 6.
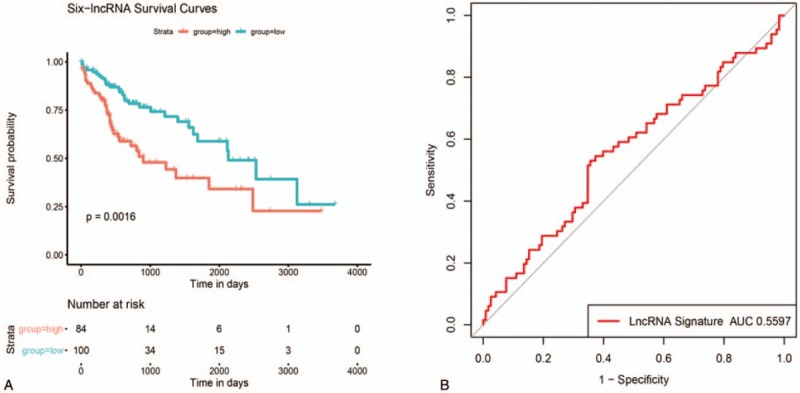
The ROC and KM curve of 6-lncRNA signature risk model. A: Survival curve of 6-lncRNA signature risk model, the horizontal axis represents survival time (d), the vertical axis represents survival probability; B: ROC curve of 6-lncRNA signature, the horizontal axis represents false positive rate, and the vertical axis represents true positive rate.