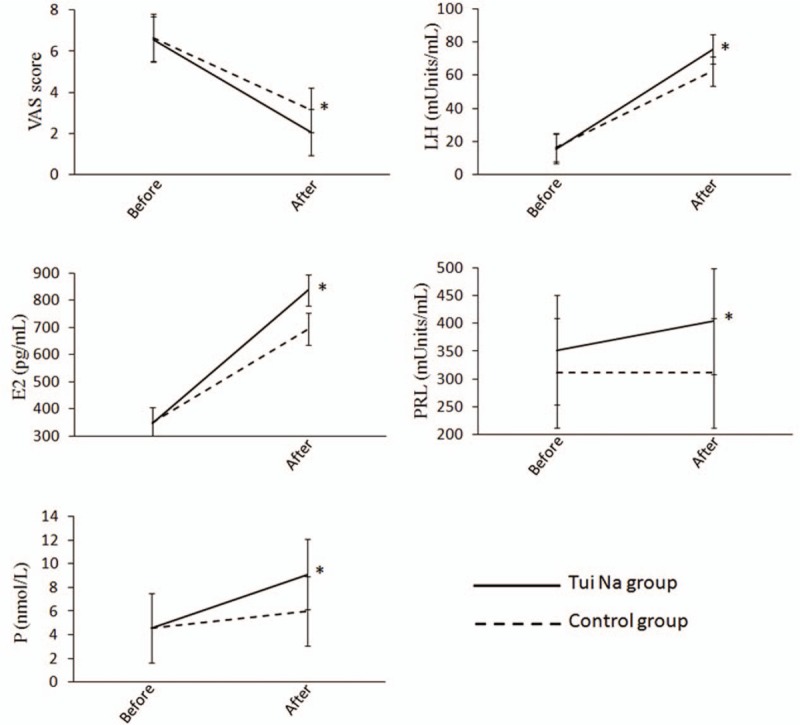
Figure 2.

Secondary outcomes in the Tui Na and the control groups (E2 = estradiol, LH = luteinizing hormone, PRL = prolactin, P = progesterone, VAS = visual analogous scale). ∗, P < .01 when comparing the Tui Na group with the control group in the post-treatment period.
