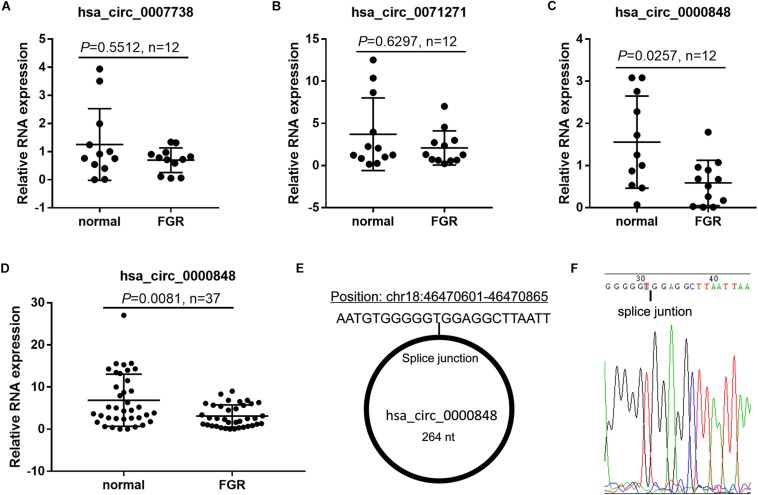
FIGURE 2.
Hsa_circ_0000848 expression was significantly down-regulated in FGR placenta. (A–C) Expression levels of hsa_circ_0007738, hsa_circ_0071271, and hsa_circ_0000848 in FGR and normal placental tissues (n = 12). (D) Expression levels of hsa_circ_0000848 in FGR and normal placental tissues (37). (E) Detailed information of hsa_circ_0000848 from circBase. (F) Sequencing analysis around the splice junction of hsa_circ_0000848 fragment in RT-qPCR. FGR vs normal using a non-parametric test, n = 37.

