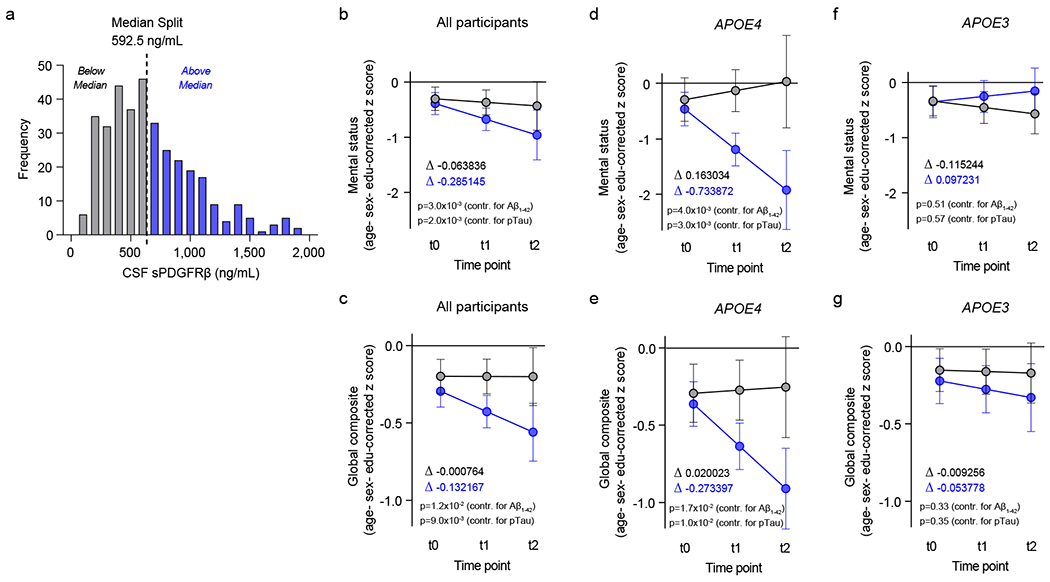
Figure 3. Elevated baseline CSF levels of pericyte injury biomarker sPDGFRβ predict cognitive decline in APOE4 carriers.

(a) Histogram frequency distribution of CSF sPDGFRβ values using median split to divide participants into two groups with high (blue, above median 600-2,000 ng/ml) and low (grey, below median; 0-600 ng/ml) baseline CSF sPDGFRβ levels. All longitudinal analyses used baseline CSF sPDGFRβ as a continuous predictor of future cognitive decline. (b-c) Linear mixed model analysis of all studied participants (n=146) followed over 2-year intervals for up to 4.5 years after baseline lumbar puncture (LP) shows that higher baseline CSF sPDGFRβ (blue) predicts greater decline in demographically-corrected mental status exam scores over time (p=0.01), which remains significant after controlling for CSF Aβ (p=0.002) and pTau (p=0.002) status (b), and in global cognitive composite scores (p=0.01), which also remains significant after controlling for CSF Aβ (p=0.017) and pTau (p=0.01) status (c). (d-e) Higher CSF sPDGFRβ (blue) in APOE4 carriers (n=58) predicts future decline in mental status exam scores (p=0.005) after controlling for CSF Aβ (p=0.004) and pTau (p=0.003) status (d), and in global cognitive composite scores (p=0.02) after controlling for CSF Aβ (p=0.02) and pTau (p=0.01) status (e). (f-g) Baseline CSF sPDGFRβ does not predict decline in APOE3 homozygotes (n=88) on either mental status (f) or global composite (g) scores regardless of CSF Aβ or pTau status. Panels b-g, for graphical depiction, separate lines indicate median split of baseline CSF sPDGFRβ (grey, below median; blue, above median). ∆ slopes provided for median split of baseline CSF sPDGFRβ groups (grey, below median; blue, above median). Time was modeled as t0 = −1 to 0.5 years post-LP, t1 = 0.5 to 2.5 years post-LP, and t2 = 2.5 to 4.5 years post-LP. The error bars are SE of the estimate. In panels b-g, significance by linear mixed model analysis; no multiple comparison correction applied. See Supplementary Information Tables 2–4 for detailed statistics.
