
Figure 2.
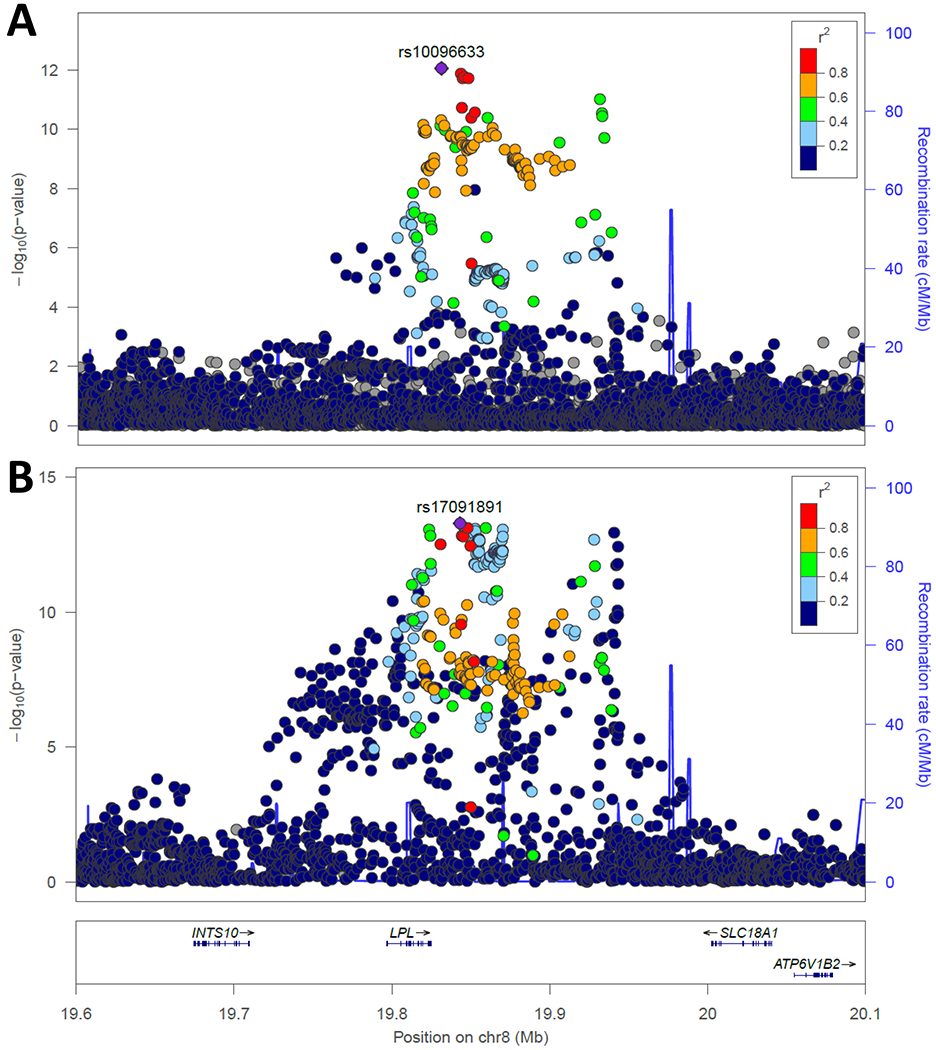
Regional association plot of the LPL locus for T2D and CHD. In these plots, P values are plotted as -log10 values as a function of genomic position. Each dot represents one SNP, with the index variant represented as a purple diamond. Color of other SNPs indicates their LD with the index SNP, per the scale on the top right. Recombination rates are represented by the blue line and genes in the region are shown at bottom. Plots were generated using publicly available summary statistics for CHD77 and T2D.41 A. Association with T2D, indexed to rs10096633. B. Association with CHD indexed to rs17091891. The two index SNPs are highly linked (r2=0.97 in Europeans).