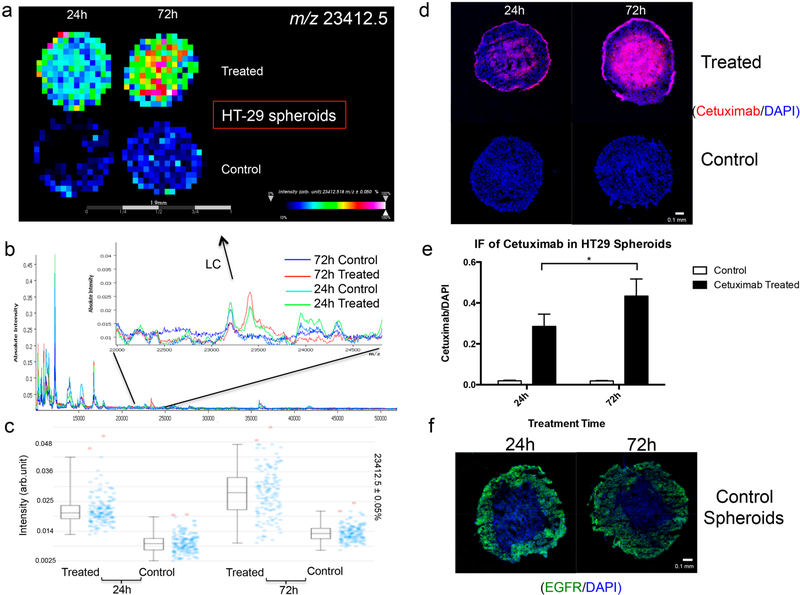
Figure 4.
(a) MALDI-MSI ion-intensity maps, (b) summed mass spectra, and (c) intensity box plots of HT-29 spheroids treated with 1 mg/mL cetuximab for 24 or 72 h. (d,e) Immunofluorescence (IF) study of cetuximab localization. Data were normalized to DAPI intensities. Statistical significance was tested using Student’s t-test (n = 6, *p < 0.05). (f) IF analysis of EGFR expression in HT-29 control spheroids.

