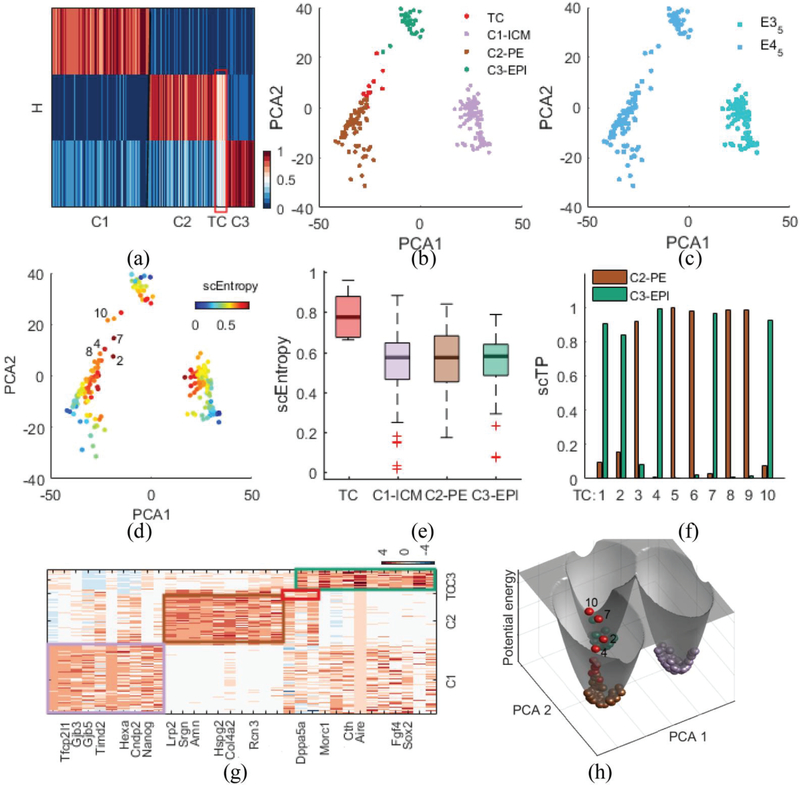
Fig. 3.
scRCMF identifies critical lineage commitments and mixed-lineage state as well as associated marker genes during mouse embryo implantation.
(a) The heatmap of coefficient matrix H, signifying three cell subpopulations (C1, C2, C3) and one transition state (TC) denoted by a red frame in the MEG dataset [28]. (b-c) Cells are visualized on the first two principal components and colored by identified clusters (b) and developmental stages (c). (d) Cells are labeled by transition entropy. 5 red cells with labels are representative transition cells. (e) Comparison of scEntropy among C1, C2, C3 and TC. (f) Transition probability (TP) of 5 transition cells to C1 and C2. Cell labels are consistent with panel (d). (g) Heatmap of the top 33 marker genes for three clusters and one transition state. Genes are ranked by average expression value in three clusters and transition states respectively. (h) Potential landscape of the data. Cells are colored as in panel (b).

