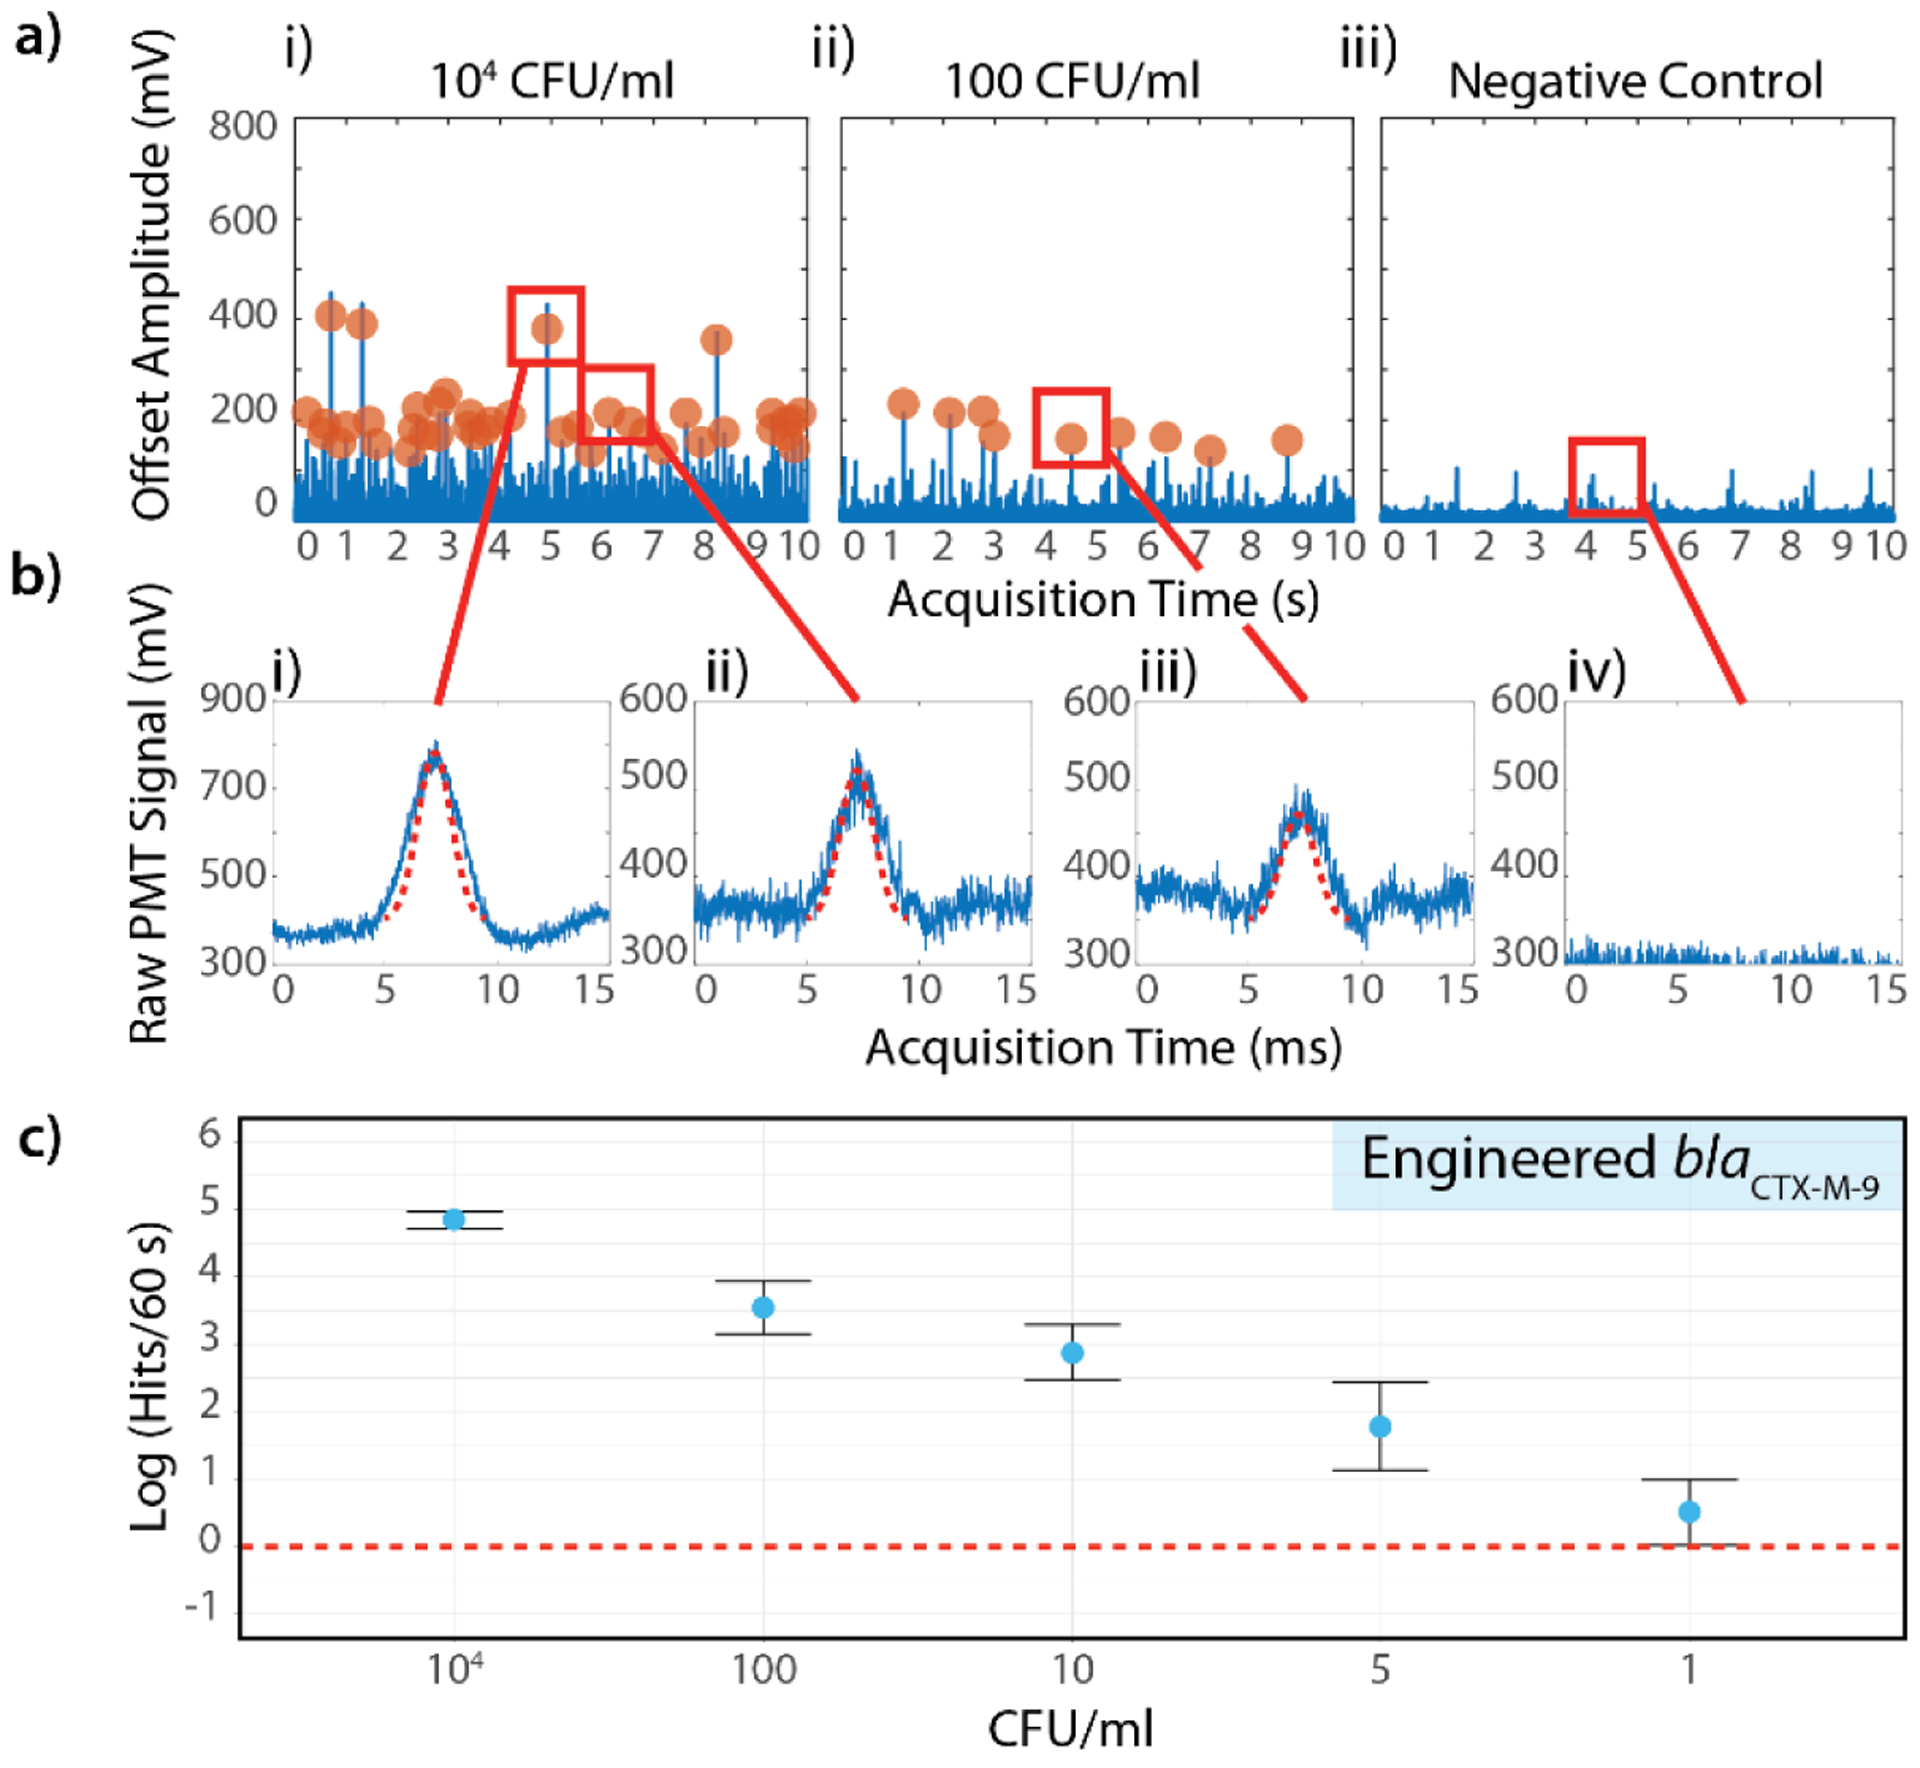
Figure 5.

Single-digit sensitivity using the IC3D blood ddPCR system. a) Representative fluorescence time trace data from (i) high concentration sample (104 CFU/ml), (ii) low concentration sample (100 CFU/ml) and (iii) negative control. E. coli strain containing the synthetic blaCTX-M-9 target gene were used as a model target. b) Representative peaks identified by the shape fitting algorithm based on variable peak amplitude, fixed width, and fixed statistical significance. i) High amplitude and ii) lower amplitude peaks both fit acceptance criteria (104 CFU/ml sample), iii) low amplitude peak identified in low concentration sample (100 CFU/ml), iv) false positive rate = 0% for negative control. c) Demonstration of IC3D sensitivity in detecting low concentrations of bacteria spiked into whole blood. Y-axis = log (events per 60s), error bars = relative error (for symmetrical display on log-scale), defined as ±0.434*stDev/y) across 3 independent sample replicates. CFU/ml (x axis) represents the number of spiked bacteria in the final measurement volume.
