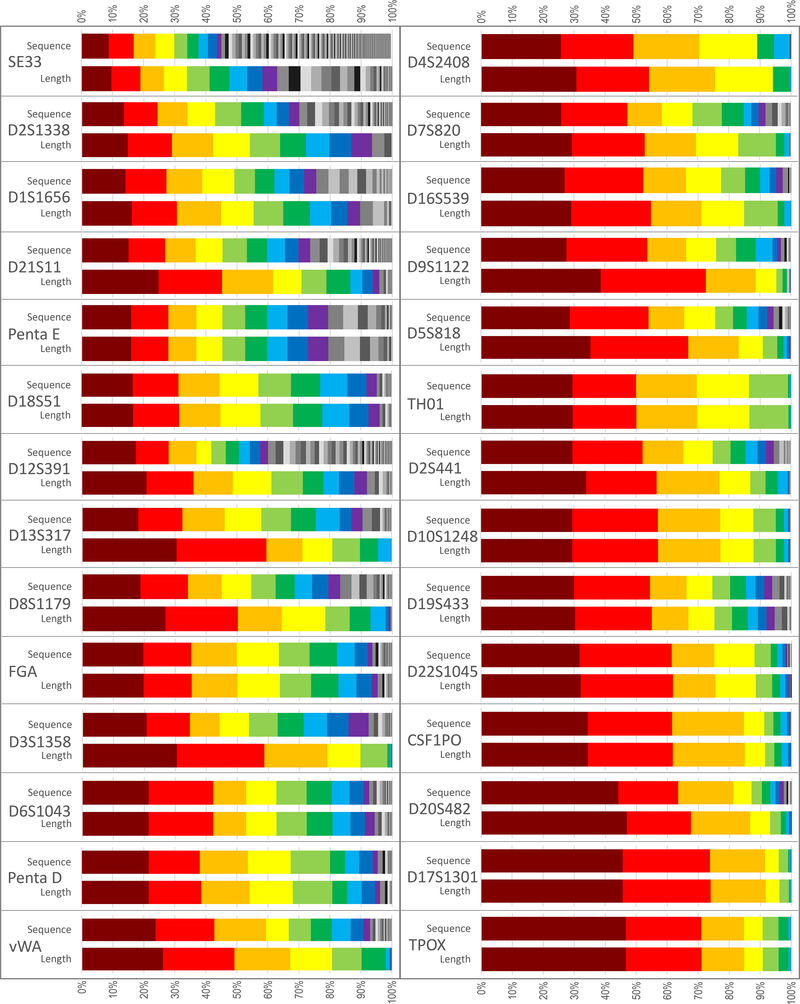
Figure 2.
Across-population allele frequency distribution per locus, by sequence and by length in N = 1036. Loci are sorted in ascending order of sequence-based frequency of the most common allele at each locus (first column top to bottom followed by second column top to bottom). The first nine alleles at each locus are colored to facilitate comparisons within and across loci, with any remaining alleles shown in grayscale. Sequence data for these samples at the SE33 locus are reported in [9].

