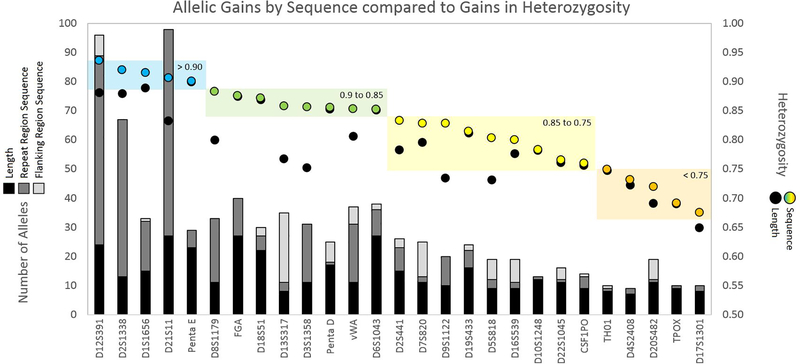
Figure 5.
Allelic gains by sequence compared to gains in heterozygosity for the 27 auSTR loci in N = 1036. Two y-axes are present: left y-axis = number of alleles, plotted as columns; right y-axis = heterozygosity, plotted as circles. Differential shading in the columns indicates number of alleles by length (black), sequence in the repeat region (dark gray), and sequence in the flanking region (light gray). Black circles represent heterozygosity by length. Colored circles represent heterozygosity by sequence, binned into ranges of heterozygosity: blue = > 0.90, green = 0.90 to 0.85, yellow = 0.85 to 0.75, and orange = < 0.75.

