
Figure 2 |. IDAA reveals the indel signature of a given gRNA.
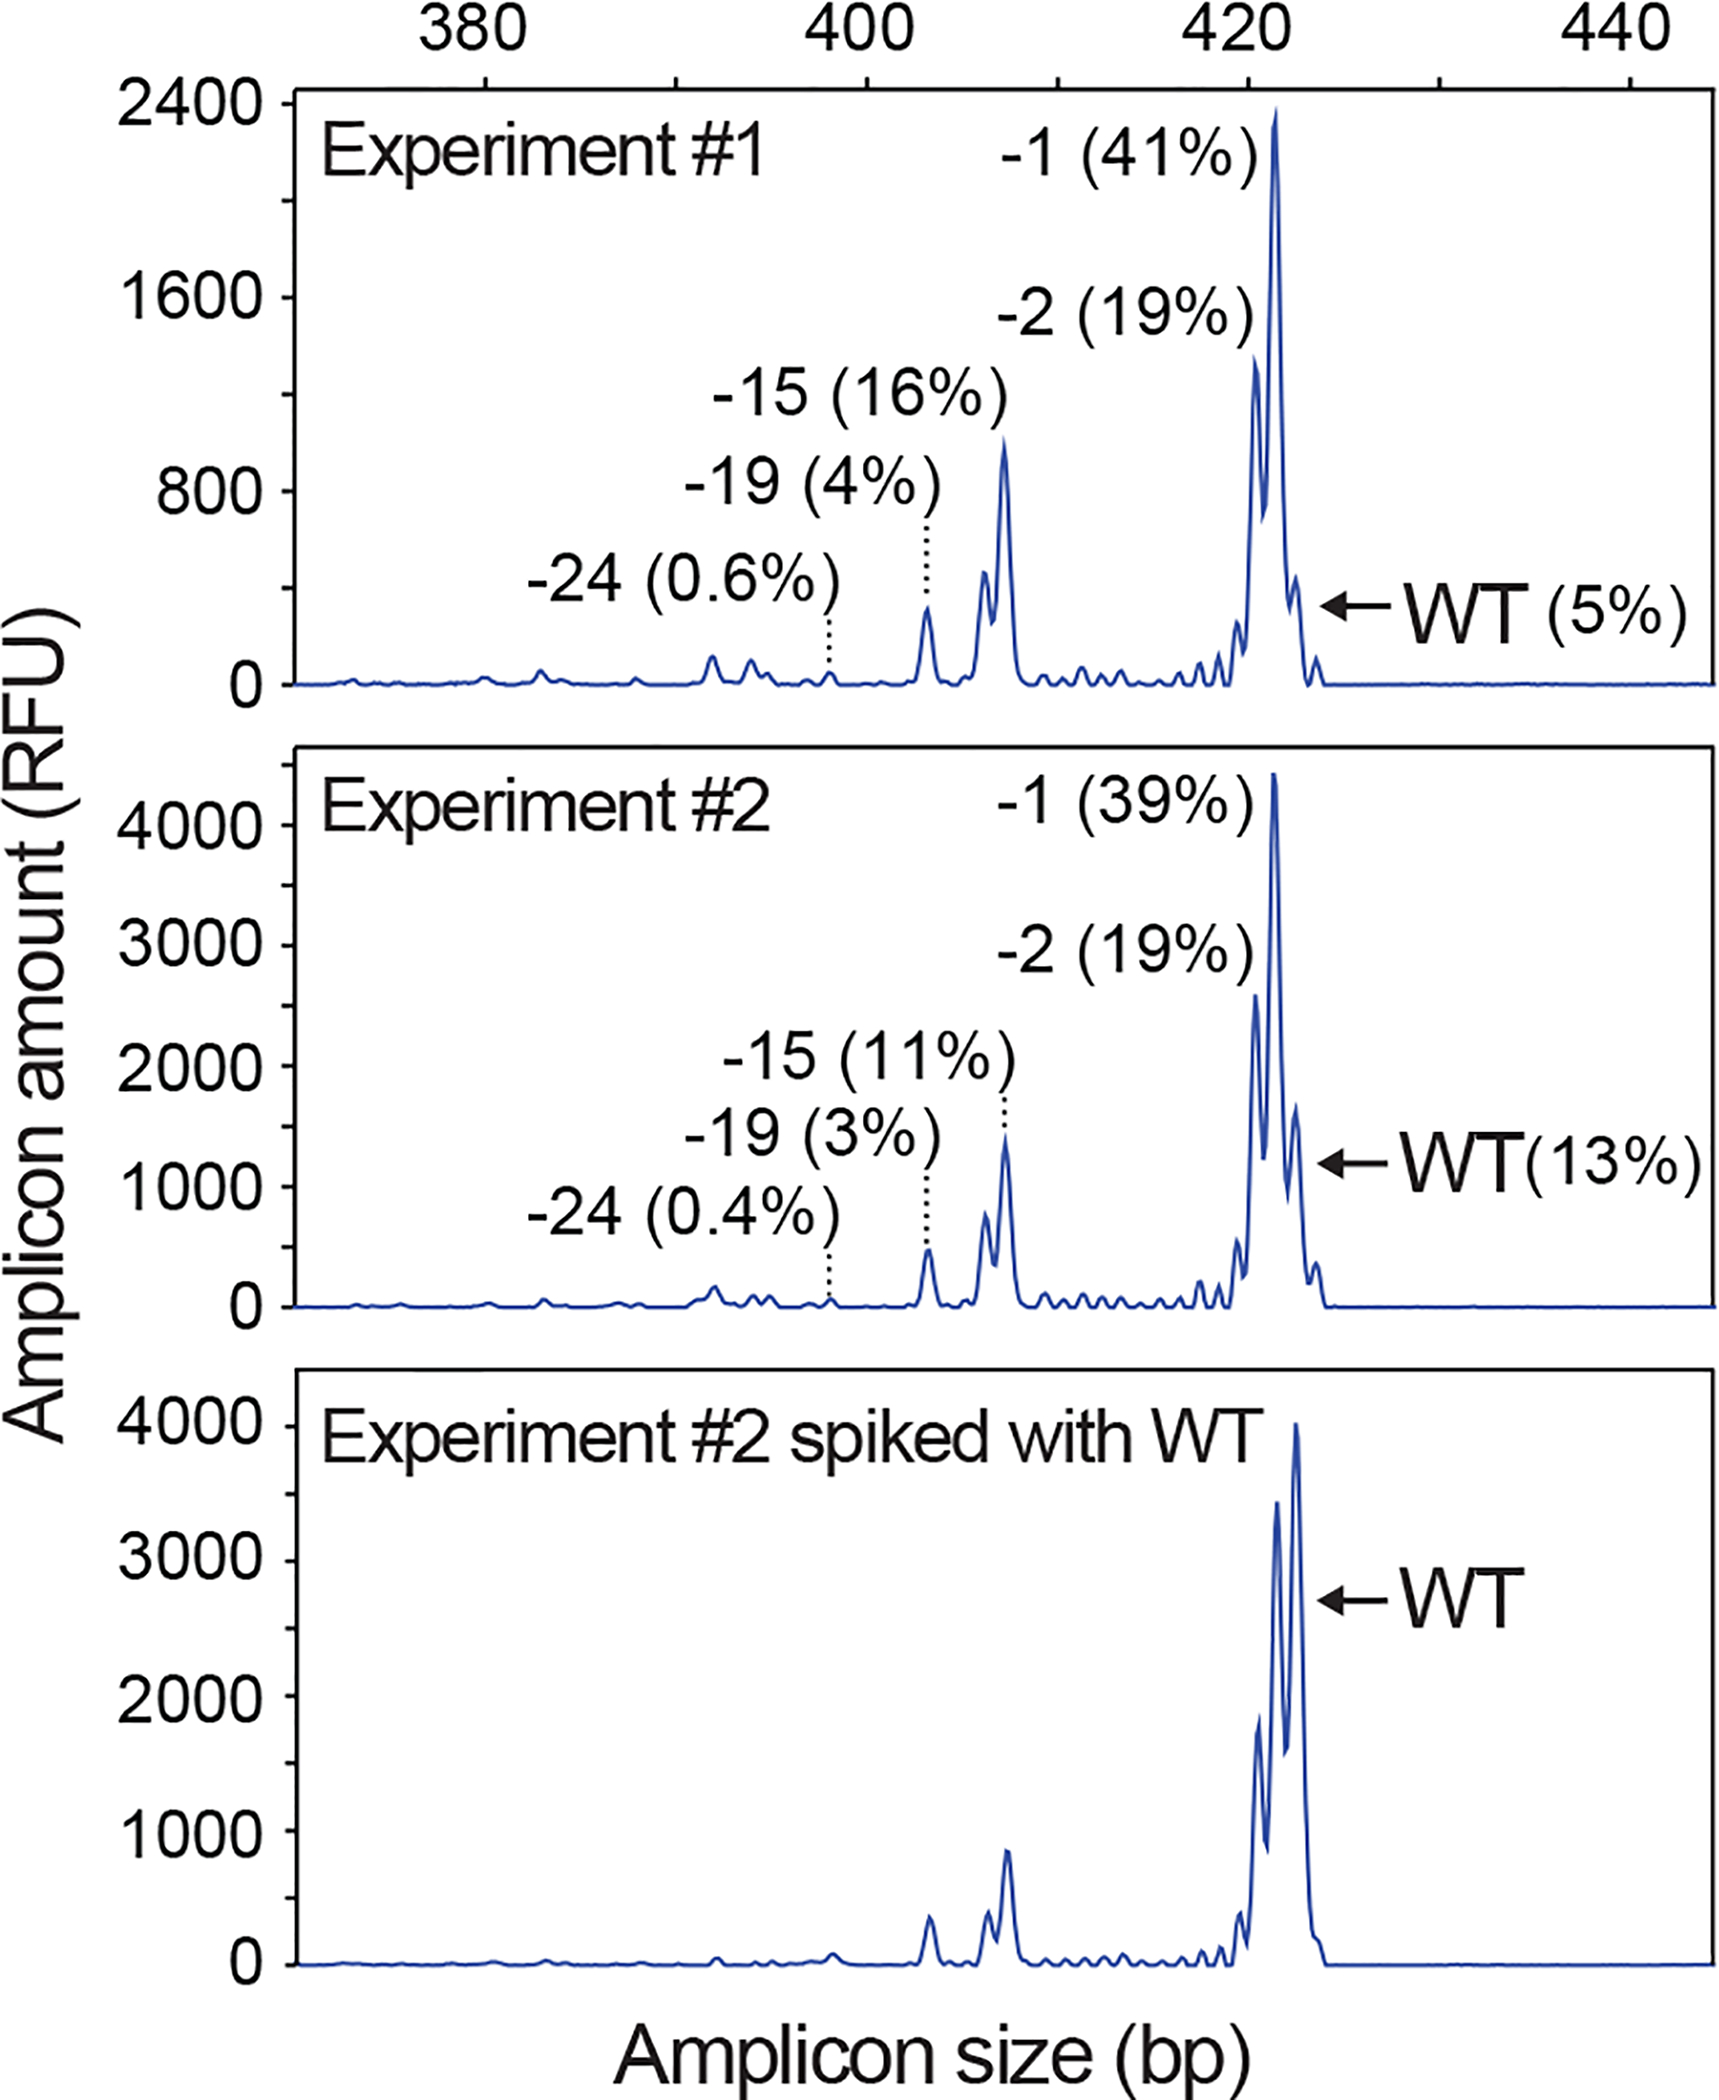
IDAA profiles for two independent experiments performed on different days and targeting the Trp53 locus using the same gRNA in mouse Neuro2A cell pools via FACS-editing as outlined in Fig. 3. Note that the two profiles are almost identical due to the reproducibility of IDAA and the pre-defined nature of indel repair at a given cut site. “Experiment #2 spiked with WT” indicates that the IDAA PCR from the edited sample was mixed 4:1 with an IDAA PCR from an untreated sample, which is a simple means to highlight the wt peak. The size and frequency of selected indels are indicated. IDAA was performed in an ABI 3130 instrument.