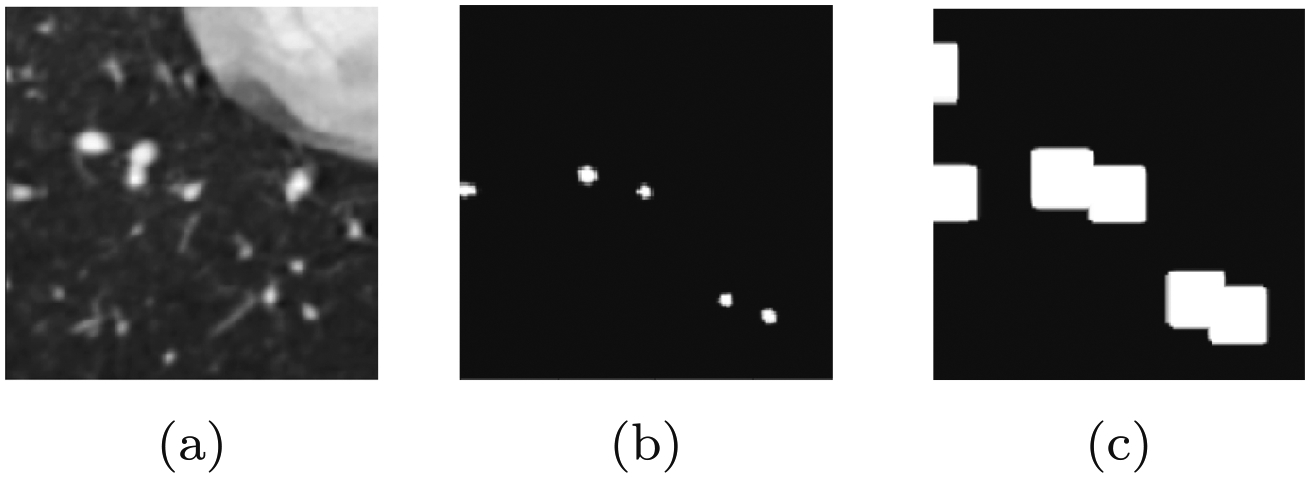
Fig. 4.

Illustration of the masked loss function generation, note how, in the label image y, some but not all vessel pixels have been labeled. a Example 2D cross-sectional input image x. b Corresponding partially labeled binary image y. c Mask image, , generated through binary dilation of label image y by a set number of pixels
