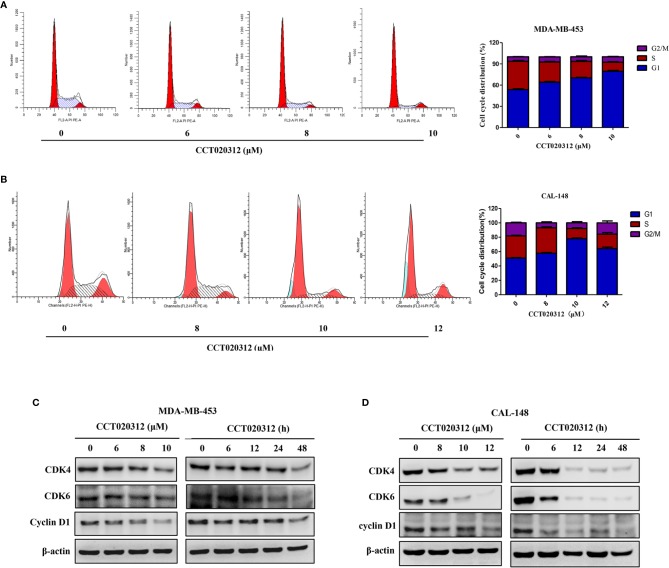
Figure 3.
CCT020312 induced G1 phase arrest in TNBC cells. (A, B) MDA-MB-453 cells (A) and CAL-148 cells (B) were treated with CCT020312 at different concentrations for 24 h. The flow cytometry was used to analyze the cell cycle data (n = 3). Data are presented as mean ± SD. (C, D) MDA-MB-453 cells (C) and CAL-148 cells (D) were treated with various of CCT020312 for 24 h, or treated with 8 and 10 μM CCT020312 for indicated time, then cells were collected to detect CDK4, CDK6, and cyclin D1 level using Western blotting.

