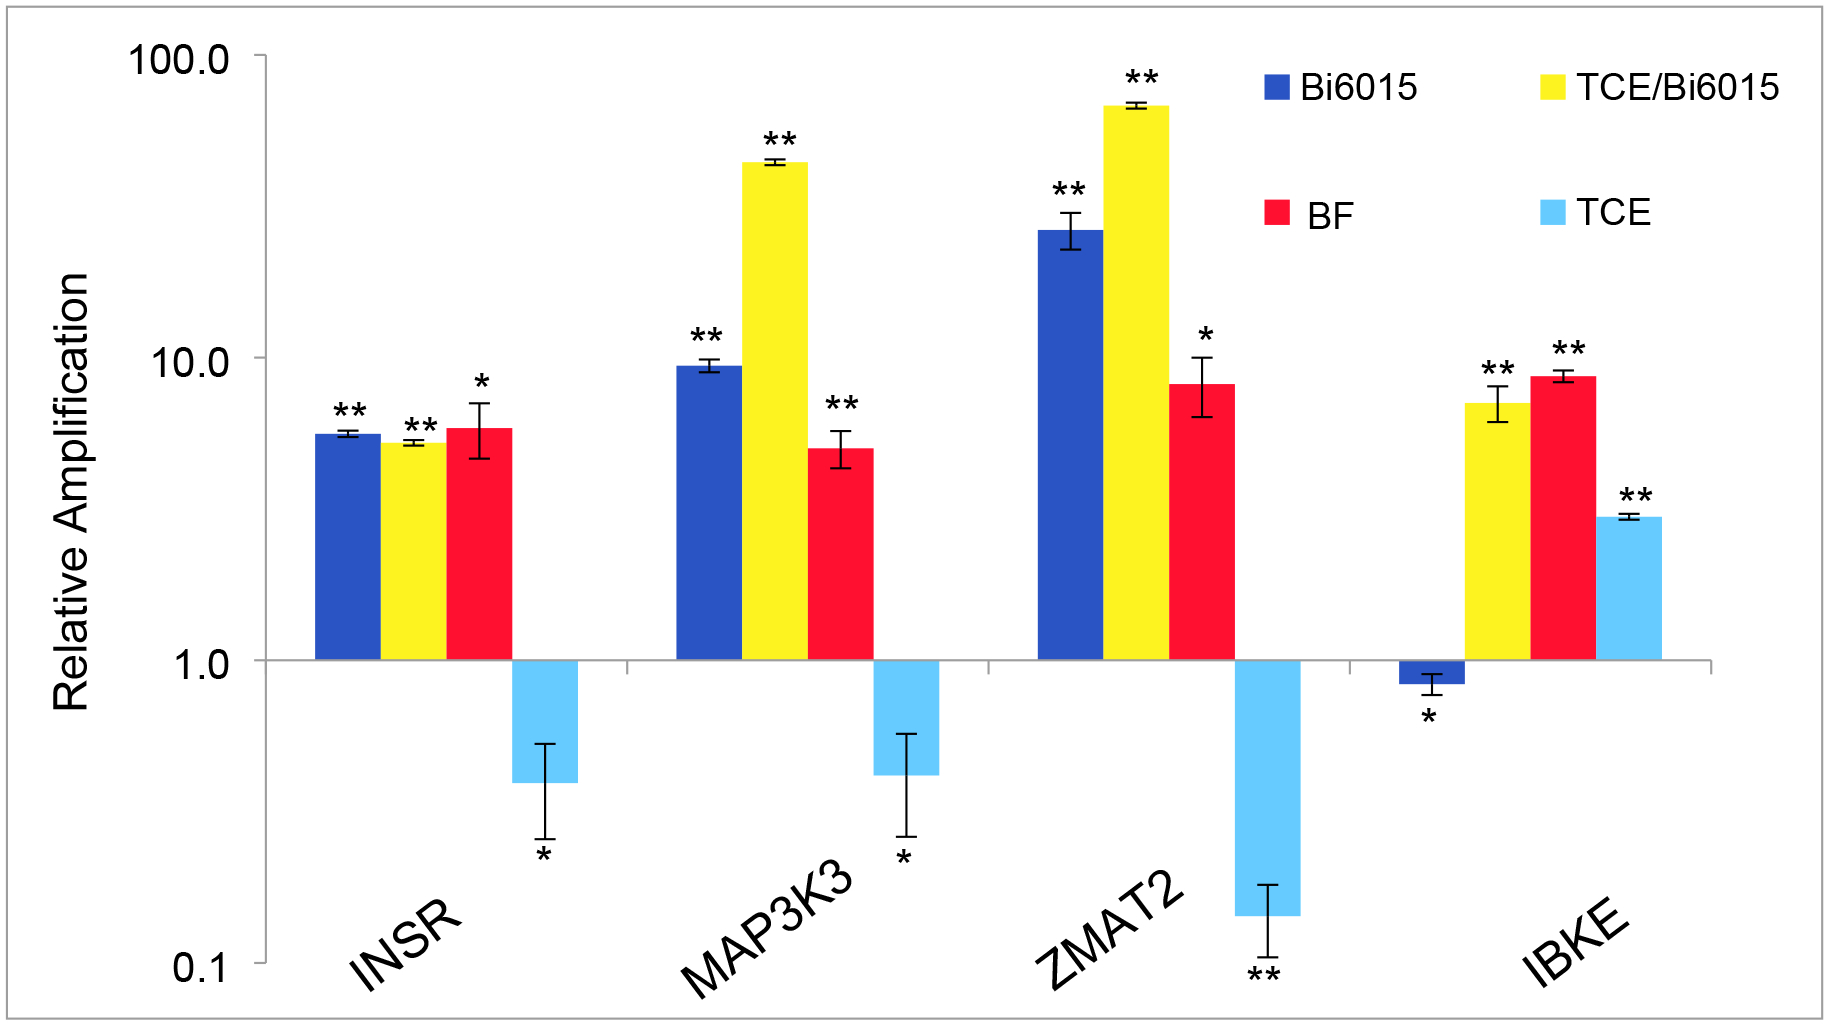
Figure 6. Comparison of the effects of TCE with Bi6015, Benfluorex or a combination of TCE and Bi6015 on selected marker expression.

qPCR measurements of selected markers were compared on RNAs extracted from pooled hearts and controls. Measurements were normalized to control litter measurements for each marker (set at 1.0) and are the average of three independent repeats. TCE and Benfluorex data is repeat of previous figures but compared here to Bi6015 and TCE with Bi6015. Scale is logarithmic to capture the large changes seen with the combination of TCE and Bi6015 exposure with MAP3K3 and ZMAT2 markers. While Benfluorex was a consistent agonist of these markers, both Bi6015 and TCE showed agonist or antagonist activity against specific markers. The combination of Bi6015 and TCE showed substantial effects on the expression of some markers but little difference from Benfluorex alone with others. Significance was evaluated by Student’s T Test (unpaired, two-tailed). *p>.05, **p>.005.
