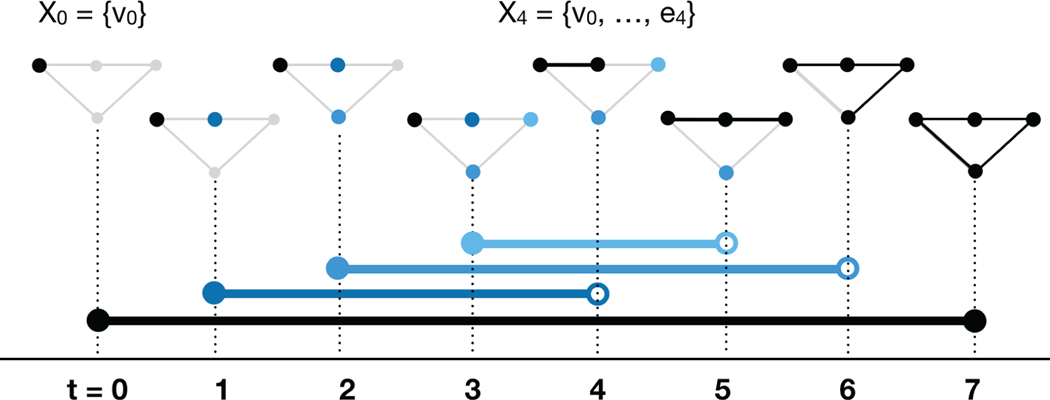
FIGURE 4.
The dimension-0 barcode of the filtered complex presented in Figure 2. Dimension-0 homology counts the number of connected components of a space, so the number of bars at time t equals the number of connected components at time t. There is one blue bar for each pivot element show in Figure 3 (equivalently, for each pivot element in Figure 4). The birth and death time for each bar may be read from the corresponding pivot. For example, the light blue bar with endpoint (3,5) corresponds to pivot (v3,e5) located in row 4, column 2 of the reduced boundary matrix. In dimension 0 only, one additional bar must be added, with birth time 0 and death time ∞. This is shown in black.

