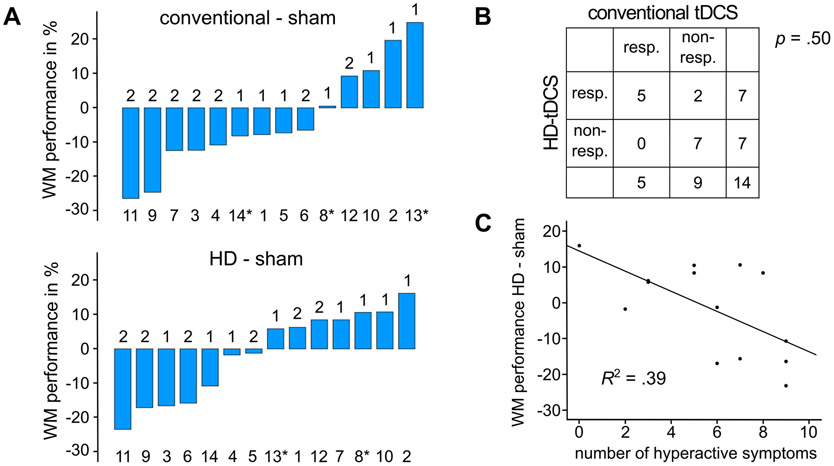
Fig. 3.
Interindividual variability. (A) Individual changes of working memory performance (WM) in response to conventional and HD-tDCS, positive values represent performance increase in tDCS conditions, numbers over the bars indicate if the verum tDCS condition was first or second to sham condition, numbers under the bars indicate individual patients with * specifying patients stimulated with reduced current intensities, (B) Number of patients that responded to stimulation for different montages, (C) Association between number of hyperactive ADHD symptoms and HD-tDCS induced working memory improvement.

