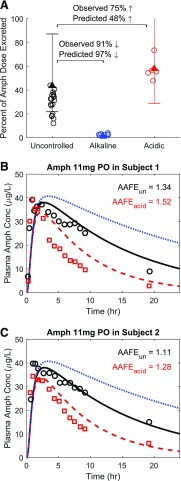
Fig. 6.
Simulation of the effect of urine pH on the urinary excretion and plasma concentration-time profile of amphetamine (Amph). Amphetamine urinary excretion over 48 hours (uncontrolled urine pH shown in black), 16 hours (alkaline urine pH shown in blue), and 16 hours (acidic urine pH shown in red) was simulated after 11 mg amphetamine oral administration (A). The observed individual data of amphetamine excretion are shown in circles (Beckett and Rowland, 1965a). The mean simulated amount (as percent of dose) of amphetamine excreted in urine under each urine pH condition is shown in triangles with 2-fold error bars. Simulated (curves) amphetamine plasma concentration-time profiles (B and C) are shown in comparison with the observed [open symbols, (Beckett et al., 1969)] data in two individual subjects under uncontrolled urine pH (black symbols and solid curve), acidic urine pH (red symbols and dashed curve), and alkaline urine pH (blue dotted curve) after 11 mg oral administration of amphetamine. The calculated AAFE values for each individual subject are shown. AAFEun represents the calculated AAFE comparing simulated and observed amphetamine plasma concentrations under uncontrolled urine pH. AAFEacid represents the calculated AAFE comparing simulated and observed amphetamine plasma concentrations under acidic urine pH.

