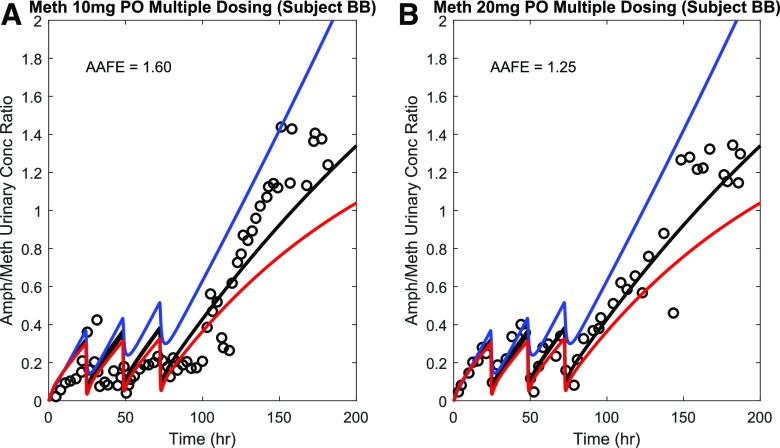
Fig. 8.
Simulation of the time course of metabolite to parent (amphetamine/methamphetamine) urinary concentration ratio after multiple oral doses of methamphetamine (Meth). Amphetamine/methamphetamine (Amph/Meth) urinary ratio was simulated under acidic urine pH condition (red curves), uncontrolled urine pH condition (black curve), and alkaline urine pH condition (blue curve) after four consecutive oral doses of methamphetamine, and compared with the observed urinary ratio (black circles) from two test sets (Oyler et al., 2002) with 10 mg dose (A) and 20 mg dose (B) under uncontrolled urine pH condition. The calculated AAFE values comparing simulation and observation under uncontrolled urine pH condition are shown in insets.

