
Fig. 1.
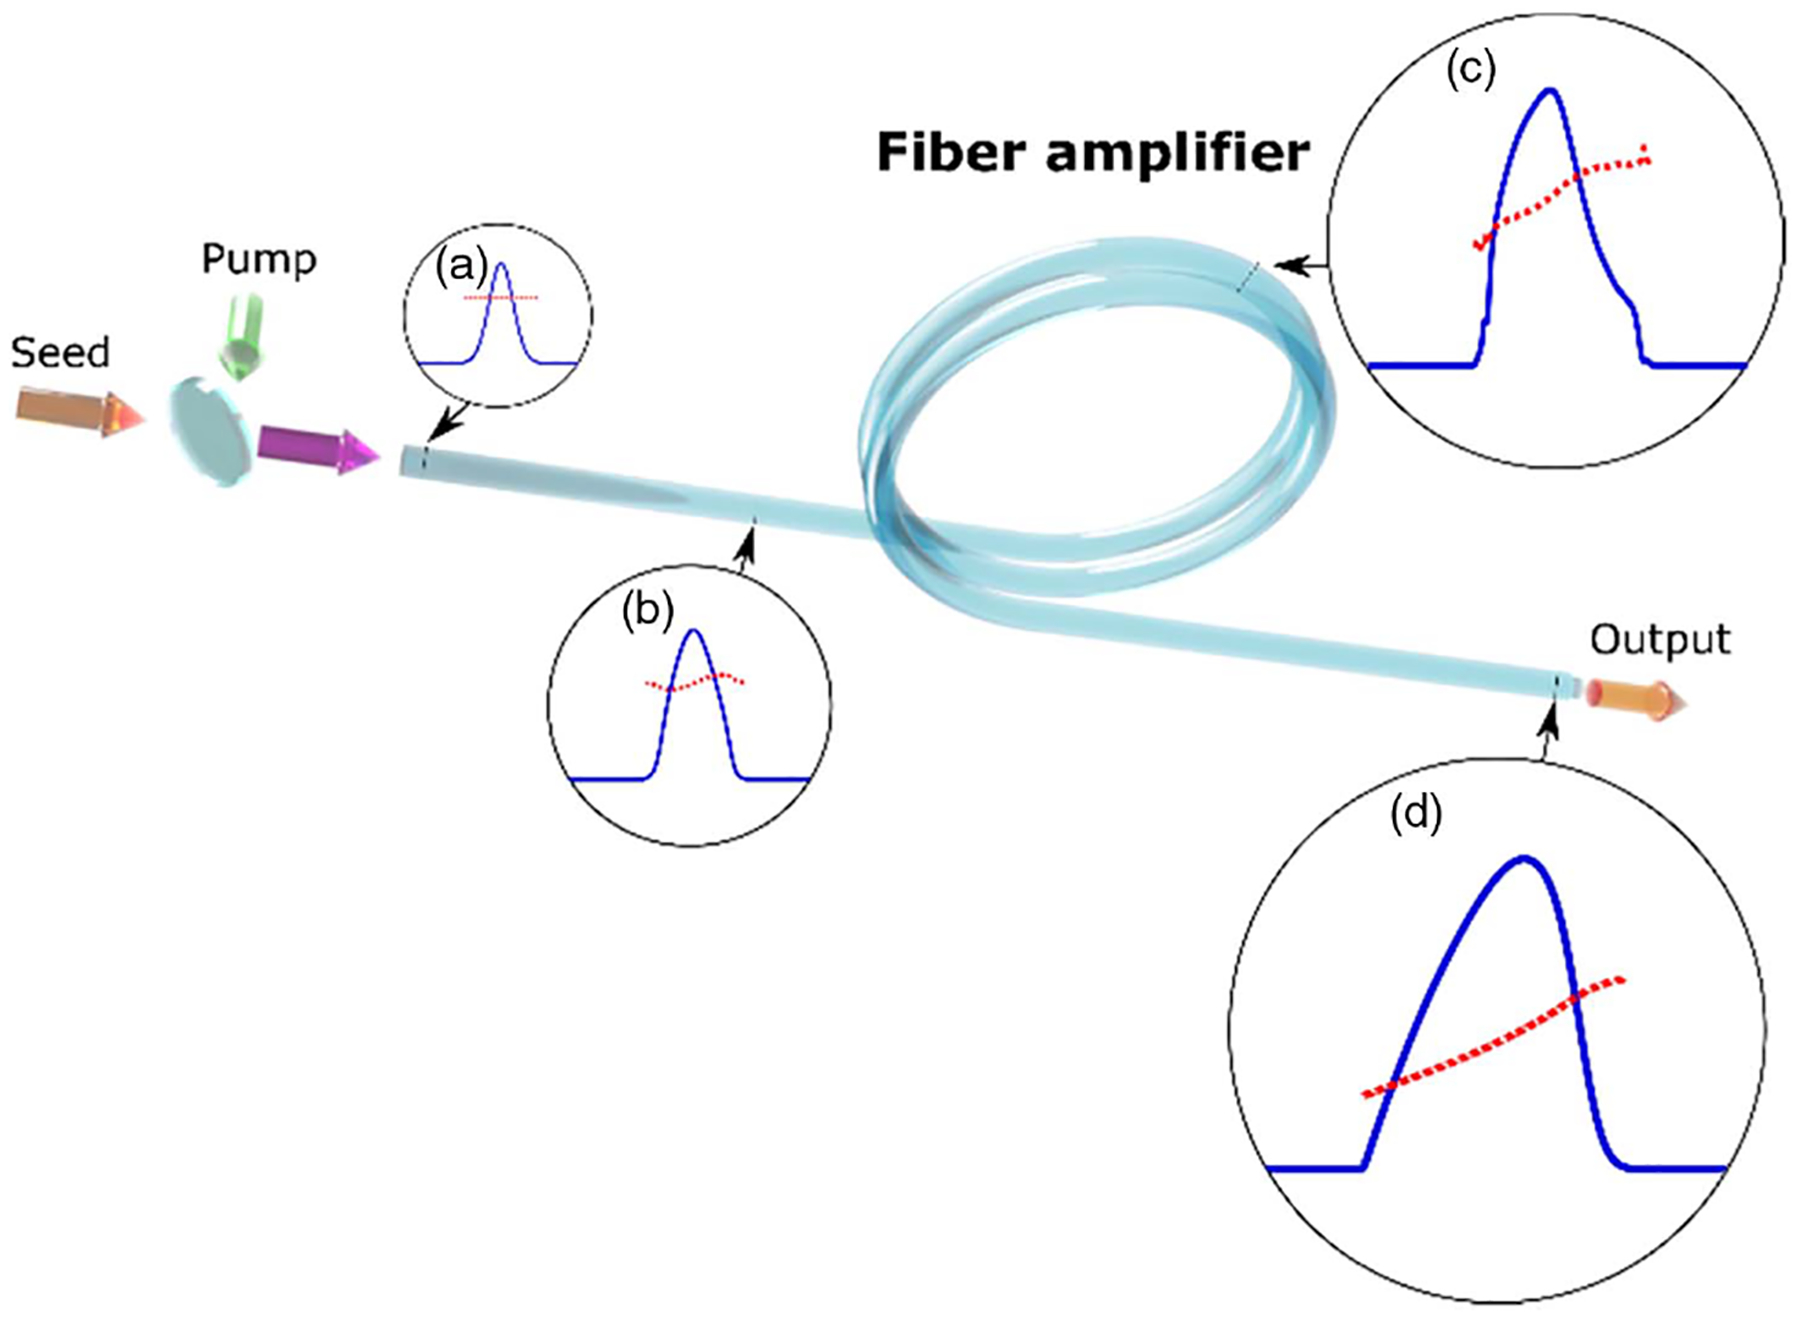
Simulated example of GMN amplification regime. The temporal intensity (solid blue line) and instantaneous frequency (dotted red line) are plotted for (a) the seed pulse, (b) the self-similar pulse, (c) the pulse beyond the self-similar regime, and (d) the pulse in the GMN regime.