
Fig. 3.
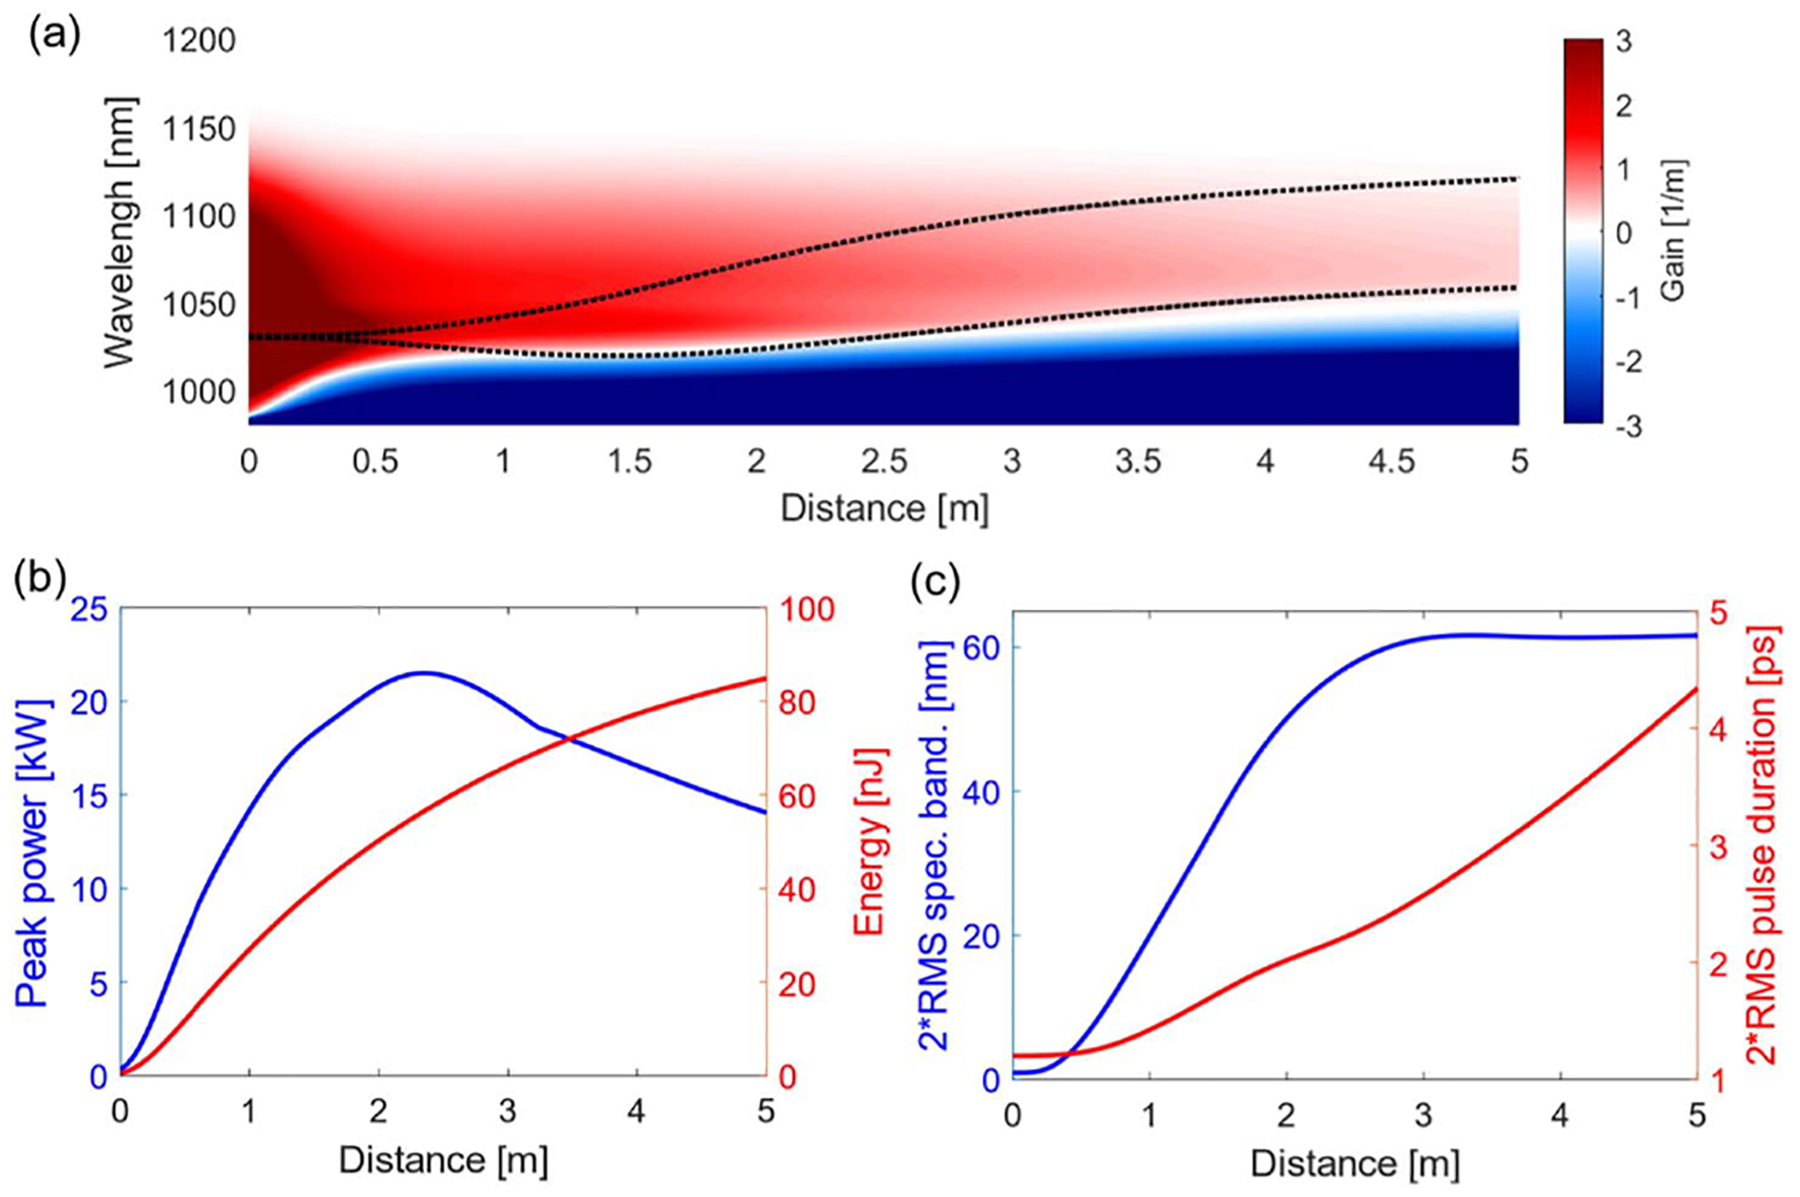
Pulse and gain evolution in a GMN amplifier. (a) Longitudinal evolution of the gain. Black dashed curves mark the pulse’s spectrum (central wavelength ± the root-mean-square bandwidth). (b) Peak power (blue) and pulse energy (red) versus propagation distance. (c) Bandwidth (blue) and chirped duration (red) of the pulse versus propagation distance.