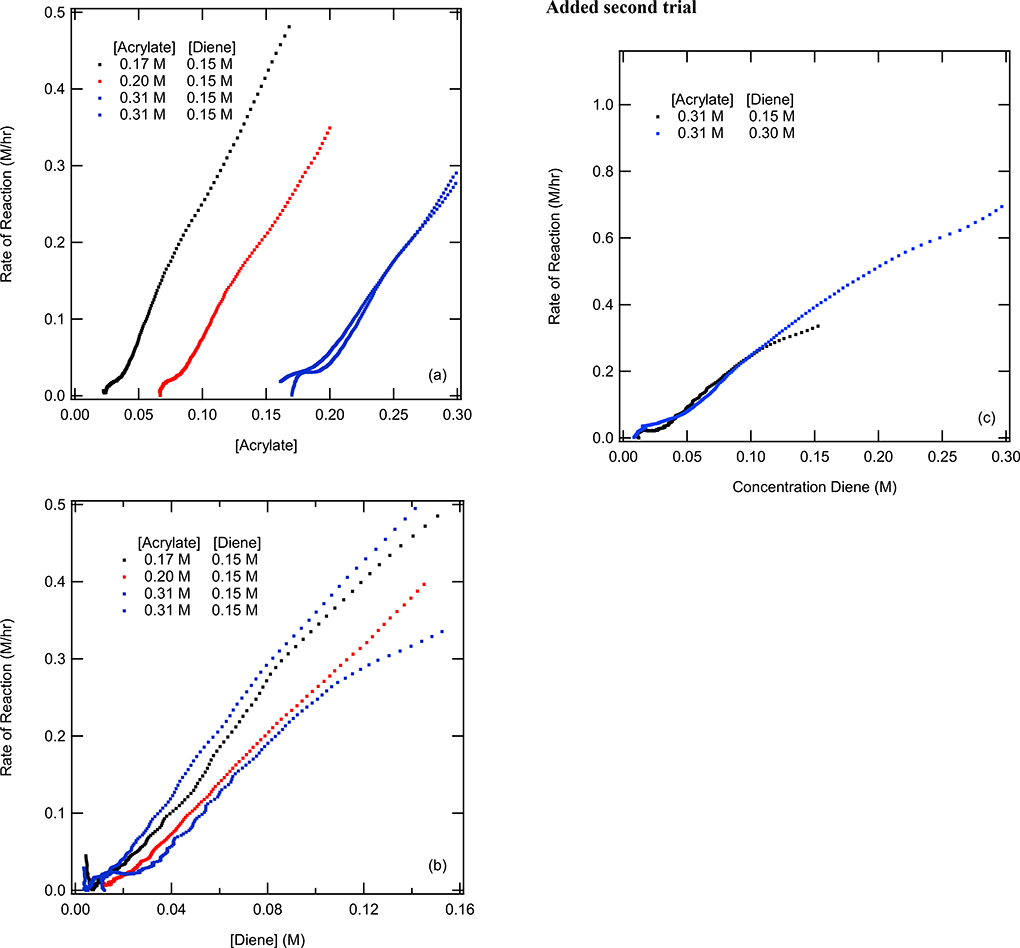
Figure 12.
Different excess experiments in which the diene and catalyst concentration was maintained constant at 0.152 M and 40 mmole respectively where the acrylate concentration was varied 0.17 M (black), 0.20 M (red) and 0.31 M (blue). (a) Acrylate rate vs acrylate concentration for different excess test. (b) Diene rate vs diene concentration for different excess experiments. (c) Diene rate vs diene concentration for change in diene concentration experiments.

