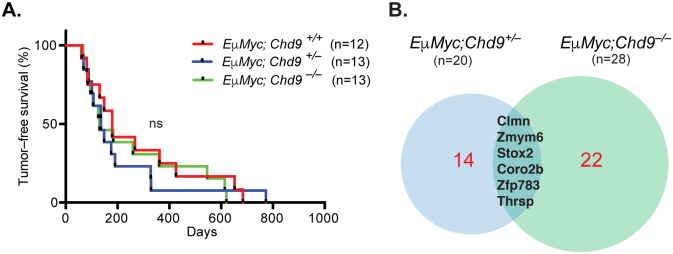
Fig 4. Chd9 deletion does not affect latency or gene expression of EμMyc–driven lymphomagenesis.
(A) Kaplan–Meier plot shows comparable tumor-free survival of EμMyc;Chd9 animals (ns = not significant, log-rank test, p–value = 0.78). (B) Venn diagram representation of the overlap between differentially expressed genes (DEGs) identified in EμMyc;Chd9+/–(left) and EμMyc;Chd9–/–(right) compared to control EμMyc;Chd9+/+ lymphomas. Numbers in parenthesis represent total number of DEGs (p-adj < 0.05, log2FC (fold change) > ±1). The DEGs common for EμMyc;Chd9+/–and EμMyc;Chd9+/+ samples are highlighted in black and non-overlapping genes in red.

