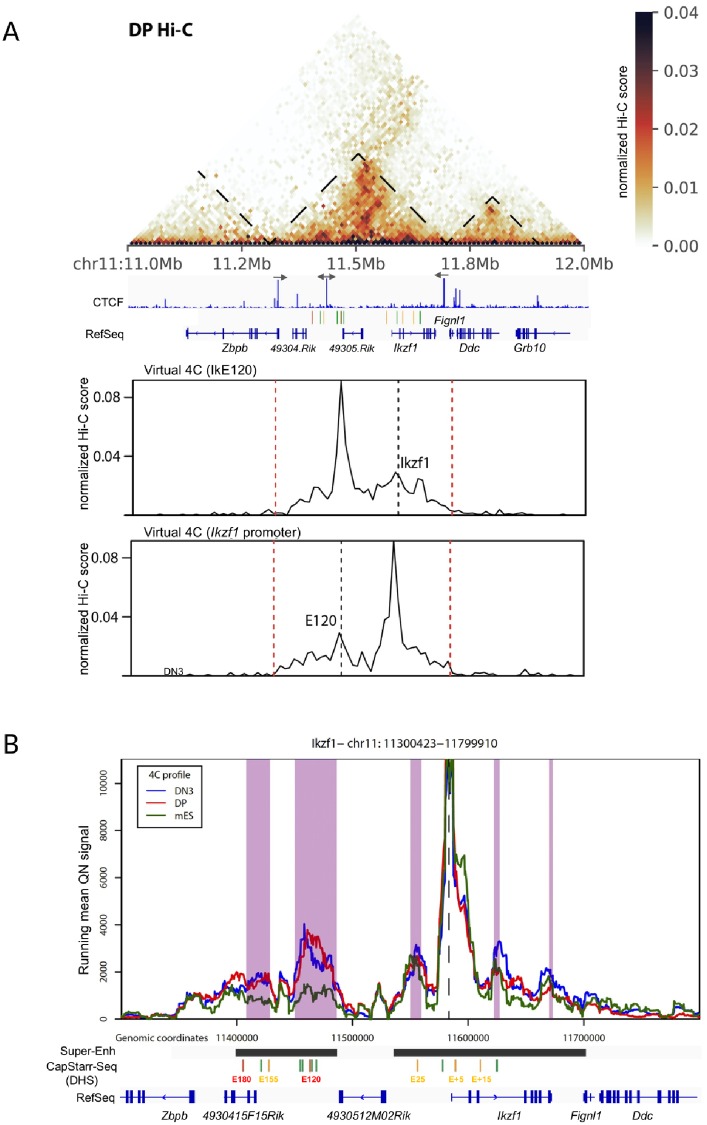
Fig 2. 3D topology of the Ikzf1 locus.
(A) Hi-C view of primary DP thymocytes around the Ikzf1 locus (top panel). TAD boundaries are shown. The orientation of the main CTCF peaks in primary DP thymocytes is displayed. Virtual 4C plots corresponding to the Hi-C interactions with the Ikzf1 promoter or the E120 enhancer are shown in the bottom panels. (B) 4C-seq analysis of Ikzf1 promoter interactions. Running mean (window of 21 fragments), quantile normalized 4C-seq profiles are shown from the Ikzf1 promoter bait (dotted line) for primary DN3 (blue) and DP (red) thymocytes and mouse ES cells (green). Locations of genes and the six regions with enhancer activity in CapStarr-seq are shown below the plot. Conserved called interactions with thymic cells are highlighted in purple.

