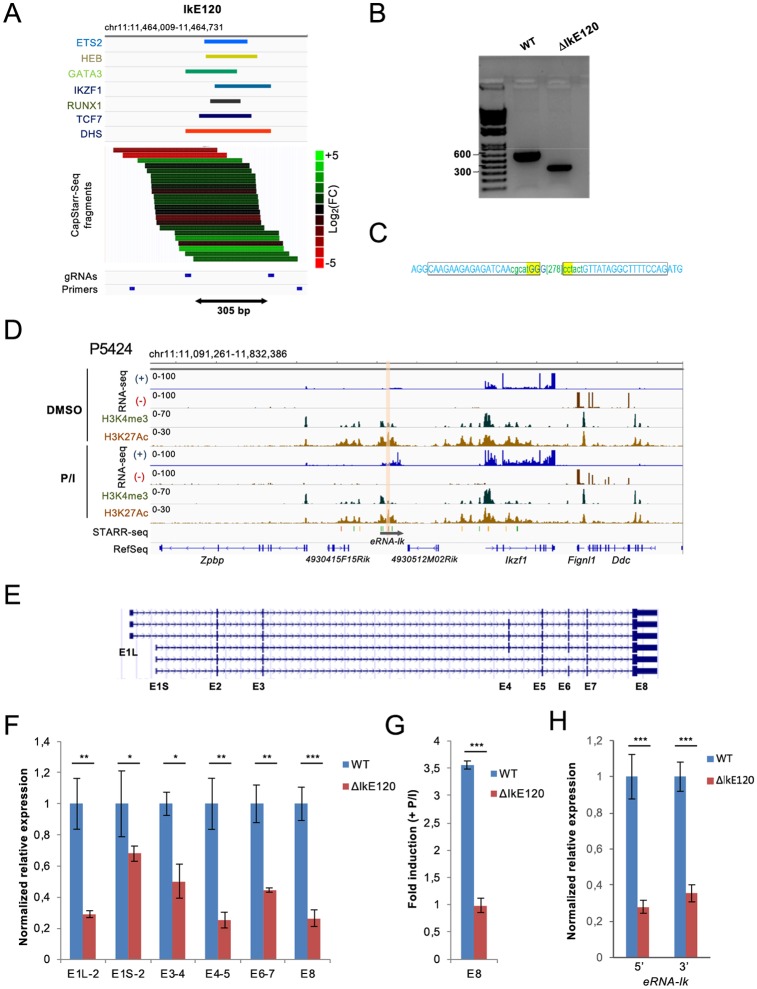
Fig 3. Deletion of the IkE120 enhancer.
(A) Genomic tracks showing the binding peaks of the indicated transcription factors overlapping the IkE120 enhancer in primary DP thymocytes as well as the enhancer activity of individual clones assessed by the CapStarr-seq assay in P5424 cells. The color scale indicates the enhancer activity as a Log2 fold change of the CapStarr-seq signal over the input. The two sgRNAs used to delete the enhancer and primers to detect the deletion are also shown. (B) PCR analyses of IkE120 deletion in the P5424 cell line. (C) Sanger sequencing results from deletion junctions amplified from the genomic DNA of the targeted ΔIkE120 clone. The rectangles represent the position of the sgRNA. The deleted region is indicated in the bracket. (D) Genomic tracks for RNA-seq and ChIP-seq around the Ikzf1 locus in P5424 cells stimulated or not with PMA/ionomycin (P/I). The IkE120 enhancer is highlighted. The scale of the RNA-seq tracks has been adjusted to visualize the non-coding transcripts overlapping the IkE120 enhancer (a screenshot with unmodified scales for the Ikzf1 gene is shown in S3 Fig) (E) UCSC genome browser showing the transcripts isoforms of the Ikzf1 gene found in RefSeq. (F) RT-qPCR analyses of Ikzf1 expression at the indicated exon-exon junctions in wt and ΔIkE120 P5424 cells. Values represent relative expression as compared with wt samples. (G) Fold induction of Ikzf1 expression (exon 8) after treatment with PMA and ionomycin of P5424 cells. (H) Relative expression of the non-coding transcripts (eRNA) overlapping the IkE120 enhancer in ΔIkE120 cells as compared with wt P5424 samples. Two sets of primers surrounding the IkE120 deleted region were used. In panels F-H, each point represents the means of three independent experiments normalized by the Rpl32 housekeeping gene. Statistical significance was assessed by Student’s t-test (unpaired, two-tailed) from 3 biological replicates (***P < 0.001, **P < 0.01, *P < 0.1). Error bars represent standard deviation.

