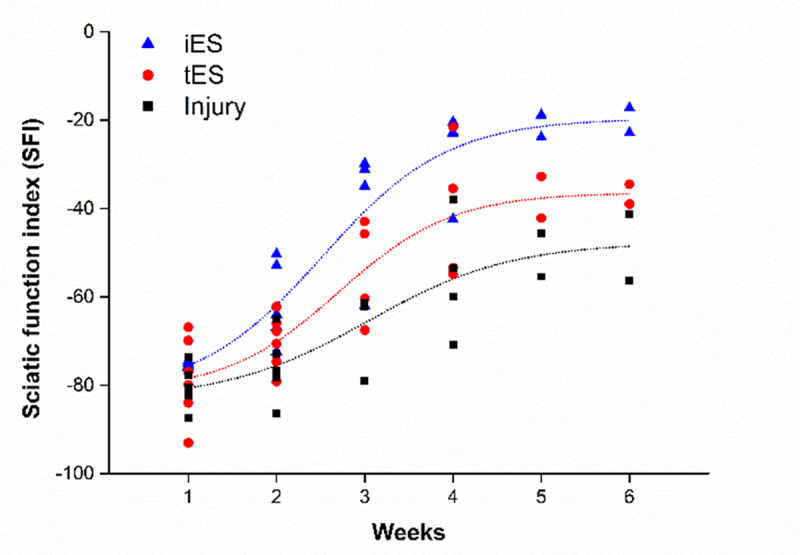
Fig 3. Temporal change in Sciatic Functional Index (SFI) in each group.

Functional recovery measured every week starting a week after surgery using the toe-spreading SFI. The dot lines on the graph was best fitted of SFI data points of each group using Boltzmann equation.
