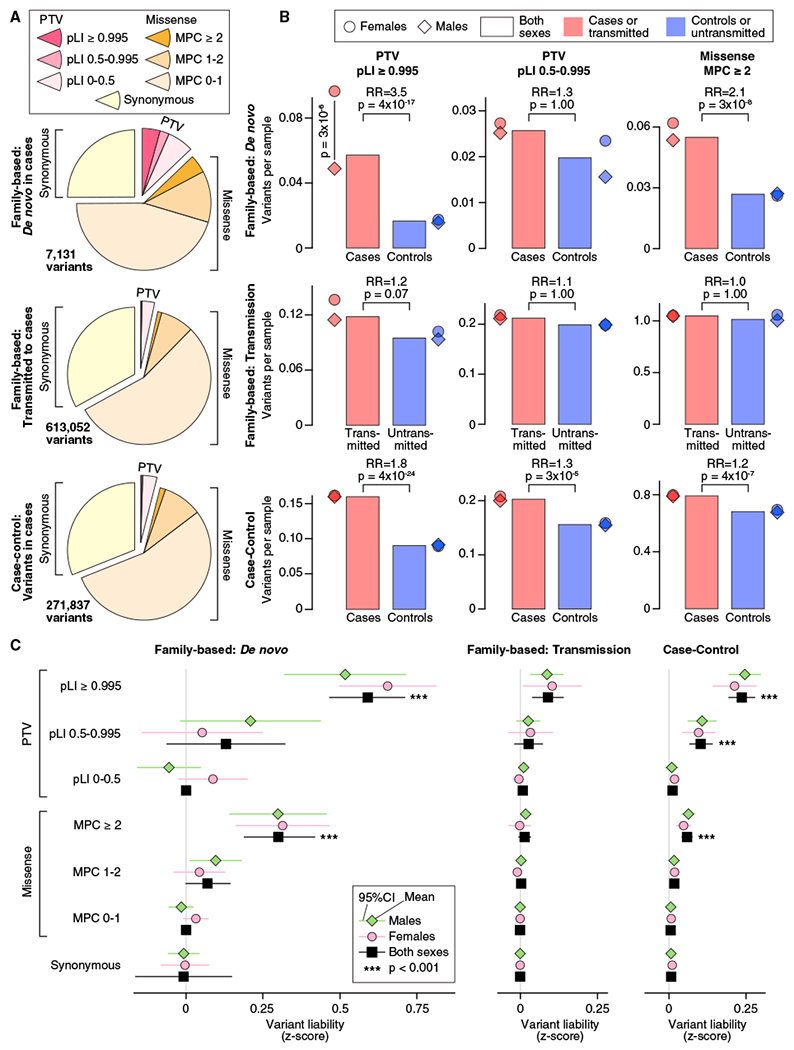
Figure 1. Distribution of Rare Autosomal Protein-Coding Variants in ASD Cases and Controls.

(A) The proportion of rare autosomal genetic variants split by predicted functional consequences, represented by color, is displayed for family-based (split into de novo and inherited variants) and case-control data. PTVs and missense variants are split into three tiers of predicted functional severity, represented by shade, based on the pLI and MPC metrics, respectively.
(B) The relative difference in variant frequency (i.e., burden) between ASD cases and controls (top and bottom) or transmitted and untransmitted parental variants (center) is shown for the top two tiers of functional severity for PTVs (left and center) and the top tier of functional severity for missense variants (right). Next to the bar plot, the same data are shown divided by sex.
(C) The relative difference in variant frequency shown in (B) is converted to a trait liability Z score, split by the same subsets used in (A). For context, a Z score of 2.18 would shift an individual from the population mean to the top 1.69% of the population (equivalent to an ASD threshold based on 1 in 68 children; Christensen et al., 2016). No significant difference in liability was observed between males and females for any analysis.
Statistical tests: (B) and (C), binomial exact test (BET) for most contrasts; exceptions were “both” and “case-control,” for which Fisher’s method for combining BET p values for each sex and, for case-control, each population was used; p values corrected for 168 tests are shown.
