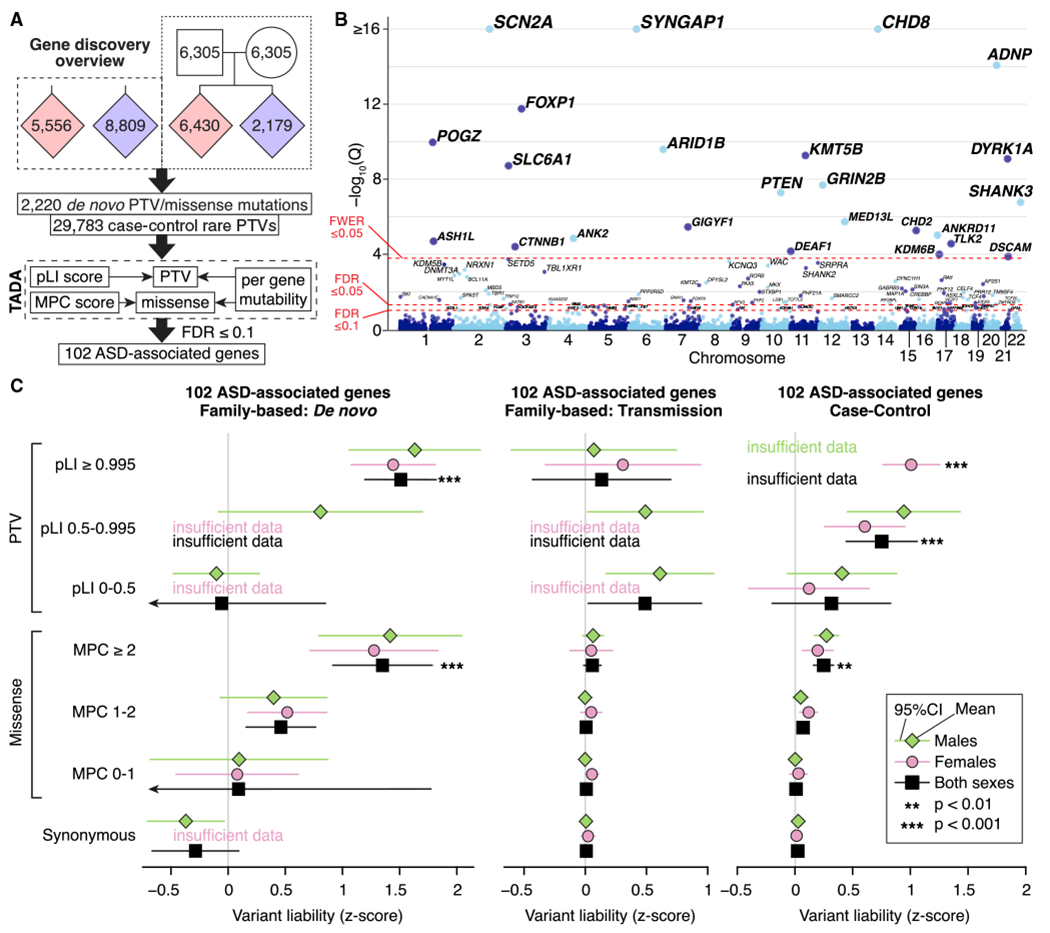
Figure 2. Gene Discovery in the ASC Cohort.

(A) WES data from 35,584 samples are entered into a Bayesian analysis framework (TADA) that incorporates pLI score for PTVs and MPC score for missense variants.
(B) The model identifies 102 autosomal genes associated with ASD at a false discovery rate (FDR) threshold of 0.1 or less, which is shown on the y axis of this Manhattan plot, with each point representing a gene. Of these, 78 pass the threshold FDR of 0.05 or less, and 26 pass the threshold family-wise error rate (FWER) of 0.05 or less.
(C) Repeating our ASD trait liability analysis (Figure 1C) for variants observed within the 102 ASD-associated genes only.
Statistical tests: (B), TADA; (C), BET for most contrasts; exceptions were “both” and “case-control,” for which Fisher’s method for combining BET p values for each sex and, for case-control, each population was used; p values corrected for 168 tests are shown.
