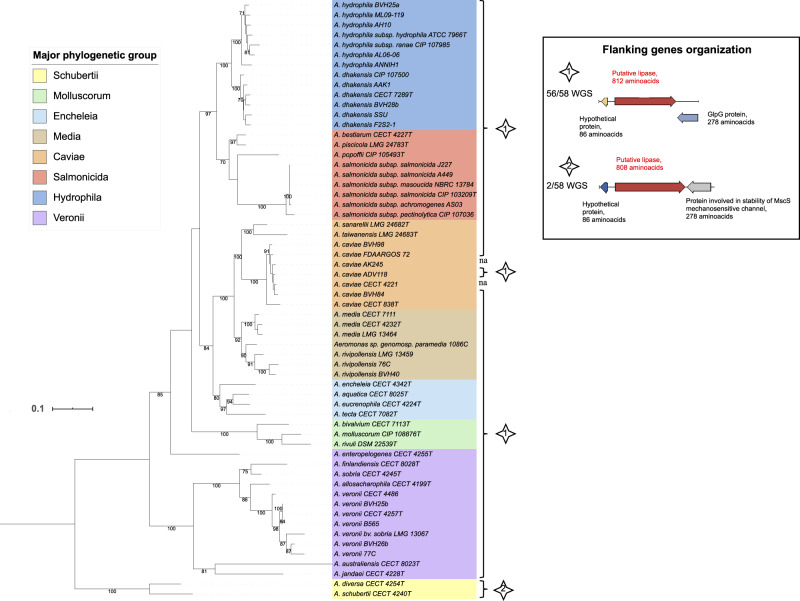
Fig. 2.
—ML tree based on alt gene sequences (2,526 nt) reconstructed using the TIM3 model plus gamma distribution and invariant sites as a substitution model with 60 complete nucleotide sequences. The two interrupted sequences (A. simiae and A. salmonicida subsp. smithia homologs of alt) are not represented in this tree. The horizontal lines represent genetic distance, with the scale bar indicating the number of substitutions per nucleotide position. The numbers at the nodes are support values estimated with 100 bootstrap replicates. Only bootstrap values ≥70 are indicated. The major phylogenetic group of each strain is indicated by colored ranges on strain labels. The type of genetic organization of the flanking genes shown in the inserted box is indicated for each strain with a numbered star. Abbreviations: na, not applicable; WGS, whole-genome sequences.

