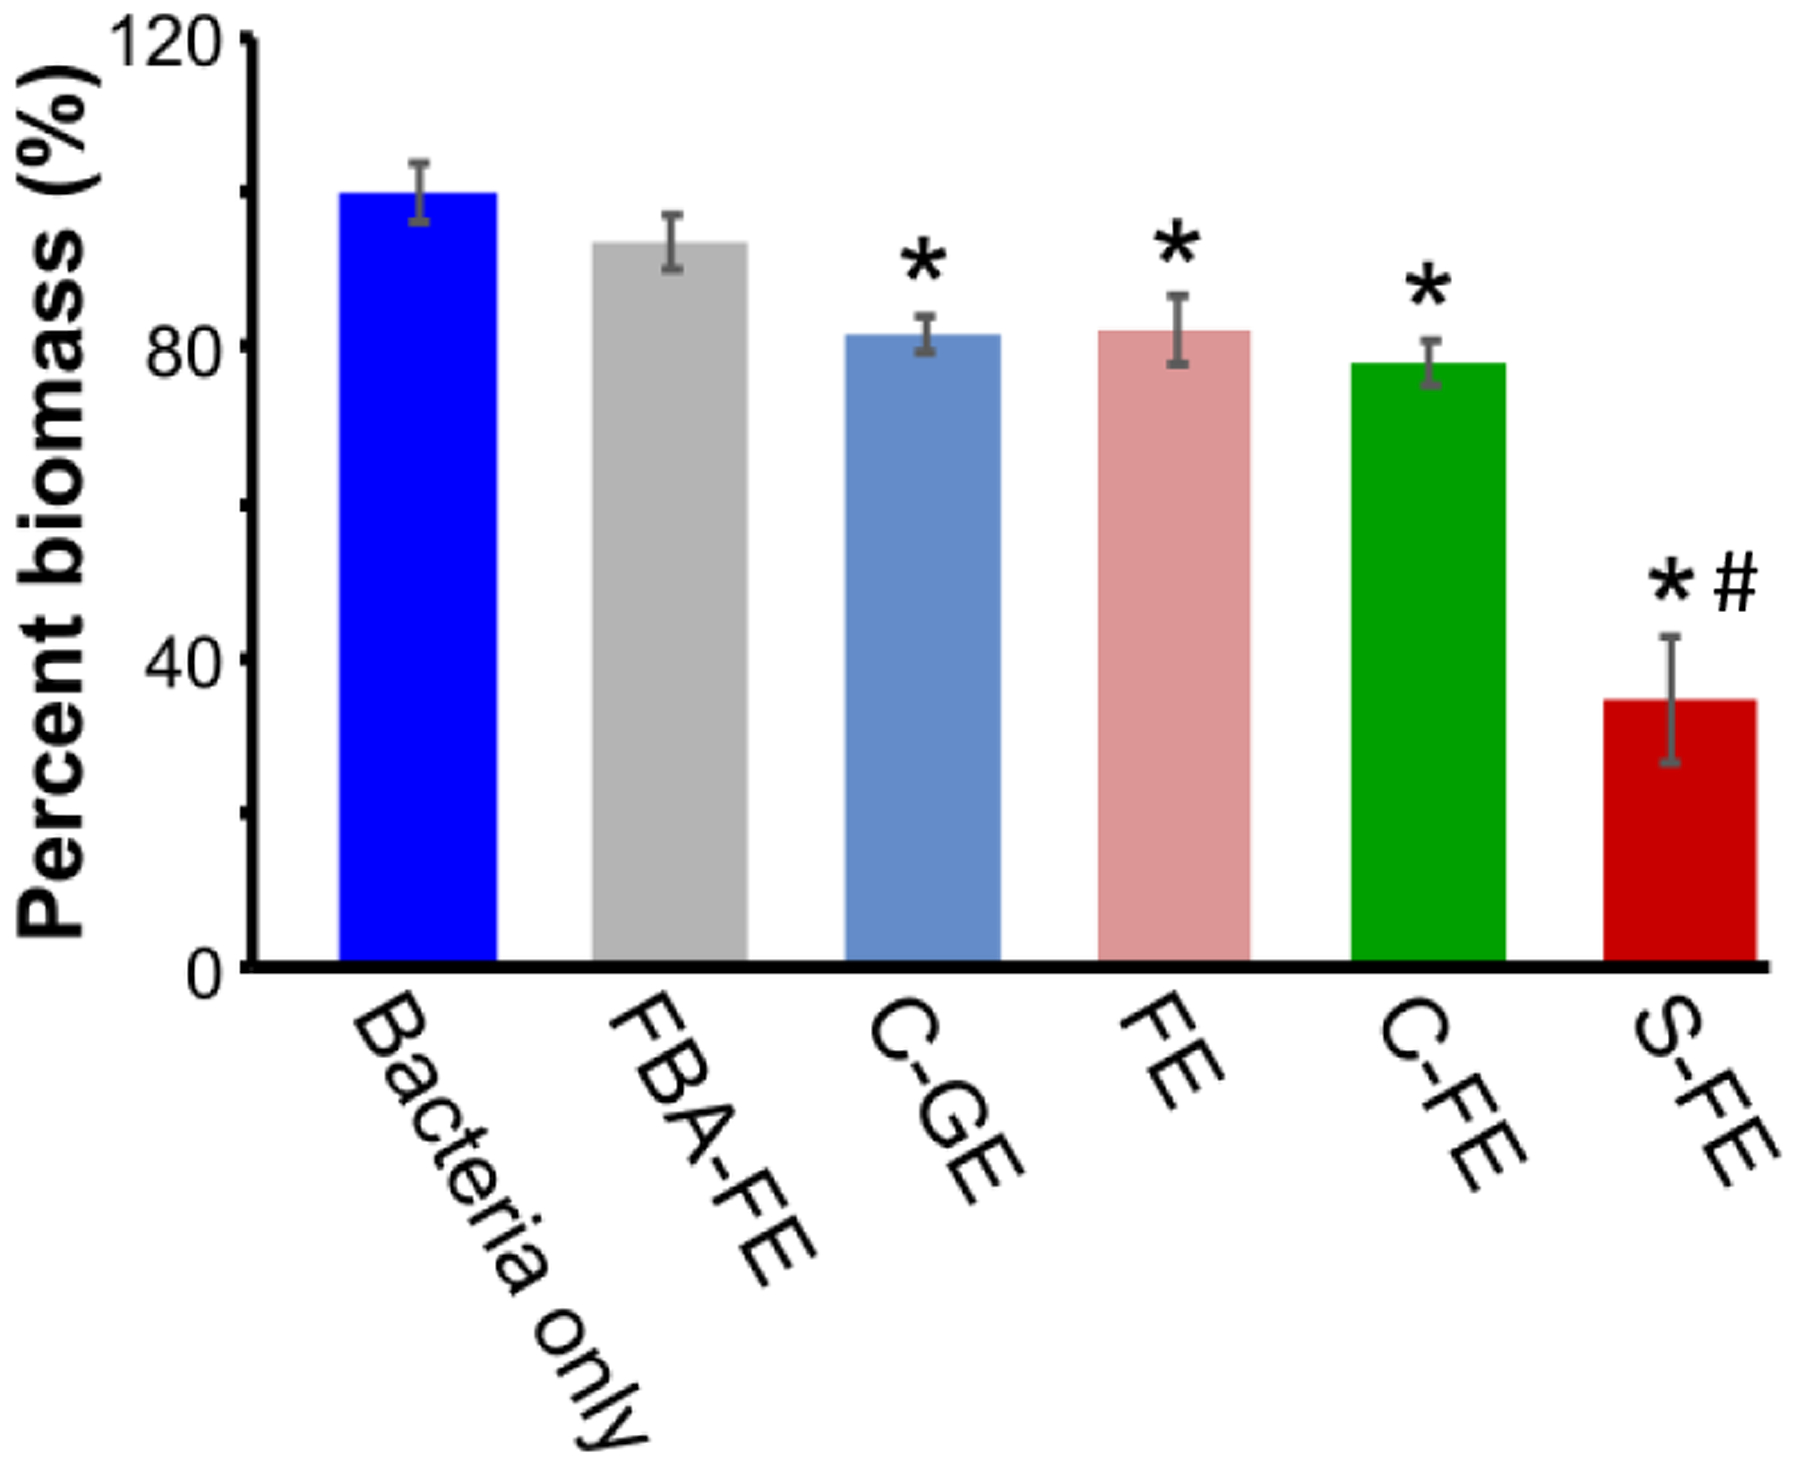
Figure 7.

Bacterial percent biomass using CV assay after treatment with dipeptides. Percent biomass values were calculated by comparing each treatment group to the bacteria only group. Mean values from five replicates are presented with standard mean of error. An ANOVA and Student’s t-test were performed with n=5. * indicates p < 0.05 with respect to bacteria only group, # indicates p < 0.05 with respect to all other groups.
