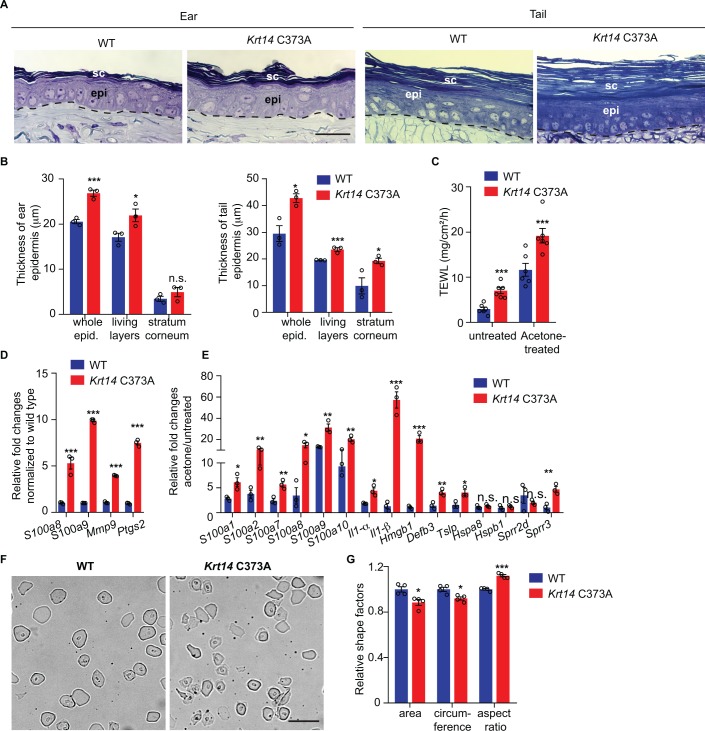
Figure 2. Alternations in morphology and barrier status in Krt14 C373A skin.
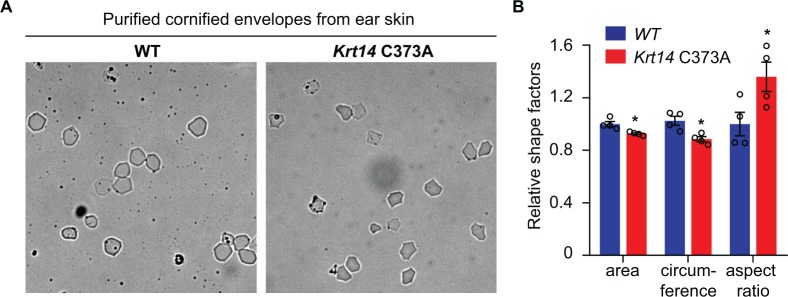
(A) Toluidine blue-stained sections (1 mm thick from epoxy-embedded skin of young adult WT and Krt14 C373A mice. (B) Quantification of whole epidermal thickness (living epidermal layers and stratum corneum layers) in ear (left) and tail (right) skin of WT and Krt14 C373A mice. Five random fields were sampled for each of 3 mice per genotype. Scale bar, 20 µm. (C) Trans-epidermal water loss measurements of WT and Krt14 C373A ear skin at baseline (untreated) and after acetone-induced barrier disruption. N = 6 per sample. D. Relative fold change in mRNA levels (qRT-PCR) for Danger-Associated Molecular Patters (DAMPs) in WT and Krt14 C373A skin at baseline. N = 3 biological replicates. (E) Relative fold change in mRNA levels (qRT-PCR) for DAMPs after acetone treatment. N = 3 biological replicates. (F) Representative phase contrast microscopy images of cornified envelopes isolated from WT and Krt14 C373A tail skin. (G) Quantitation of surface area, circumference, and aspect ratio of cornified envelopes in d. Approximately 100 CEs were counted for each of four mice. Data represent mean ± SEM. Student’s t test: *p<0.05; **p<0.01; ***p<0.005; n.s., no statistical difference. Scale bar, 100 µm.


