. 2020 May 5;9:e53165. doi: 10.7554/eLife.53165

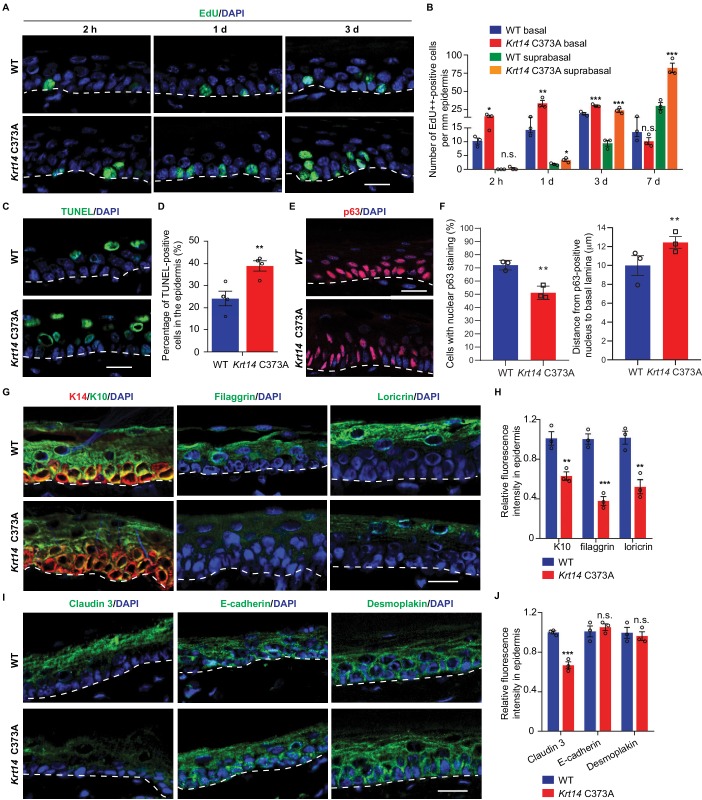
Figure 3. Altered tissue homeostasis and dysregulated keratinocyte differentiation in Krt14 C373A skin.

(A) Indirect immunofluorescence for Edu in tail skin section from WT and Krt14 C373A at 2 hr, 1 d, and 3 d after treatment with thymidine analog EdU. Nuclei as stained with DAPI (blue). (B) Quantification of number of EdU-positive nuclei in basal and suprabasal layers per mm of epidermis. N = 3 replicates for each sample. (C) TUNEL staining in tail epidermis of young adult WT and Krt14 C373A mice. D. Quantification of TUNEL-positive cells shown in frame c. N = 4 mice per sample. E. Indirect immunofluorescence for p63 in tail skin section from WT and Krt14 C373A tail skin. Dashed lines depict the dermo-epidermal interface. (F) Quantification of the number of p63-positive nuclei per mm of epidermis (left) and their distance from the basal lamina (right). N = 3 replicates for each sample. (G) Indirect immunofluorescence for K14 (green), K10 (red), filaggrin, and loricrin from tail skin sections of WT and Krt14 C373A mice. (H) Quantification of relative fluorescence intensity of data shown in frame g, normalized to WT. N = 3 mice per sample. (I) Indirect immunofluorescence for claudin 3, E-cadherin and desmoplakin in tail skin sections from WT and Krt14 C373A mice. (J) Quantitation of relative fluorescence intensity in g. N = 3 mice per sample. In a, c, e, g, and I, nuclei are stained with DAPI (blue), and dashed lines depict the dermo-epidermal interface. Scale bars, 20 µm. Data in b, d, f, h and g represent mean ± SEM. Student’s t test: *p<0.05; **p<0.01; ***p<0.005; n.s., no difference.

Figure 3.

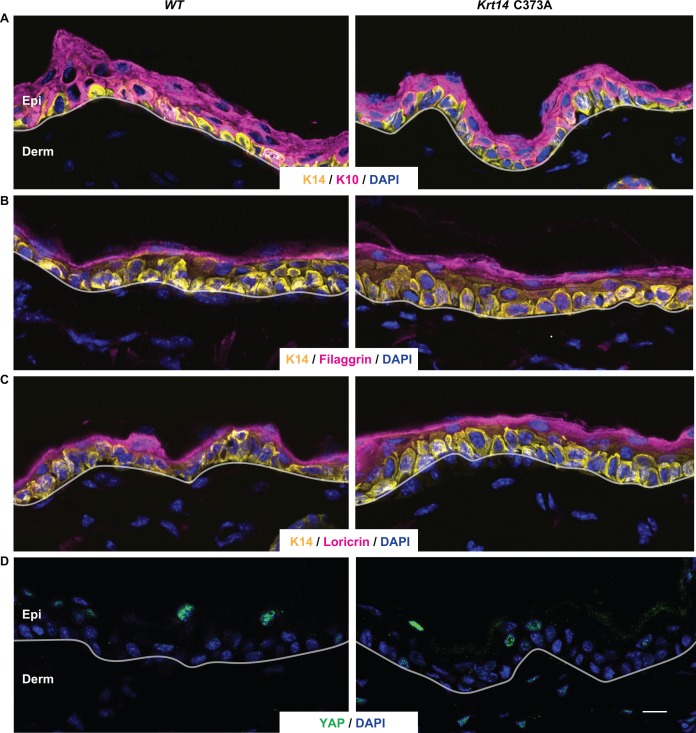
Figure 3—figure supplement 1. Analysis of terminal differentiation in mouse back skin tissue.

Figure 3—figure supplement 1.

(A-C) Cryosections of back skin tissue from young adult WT and Krt14 C373A were subjected to dual indirect immuno-fluorescence using antibodies to (A) K14 and K10; (B) K14 and filaggrin; and (C) K14 and loricrin. (D) Same as A, except that an antibody to Yap1 was used. Unlike the case for tail and ear skin tissue (see Figures 2 and 3), Krt14 C373A epidermis exhibits a normal thickness, a normal distribution of differentiation markers. Consistent with the literature (Beverdam et al., 2013), YAP1 staining is much reduced and not confined to the basal layer in back skin epidermis. Nuclei are stained with DAPI (blue), and dashed lines depict the dermo-epidermal interface. Epi, epidermis; Derm, dermis. Scale bar, 20 µm.

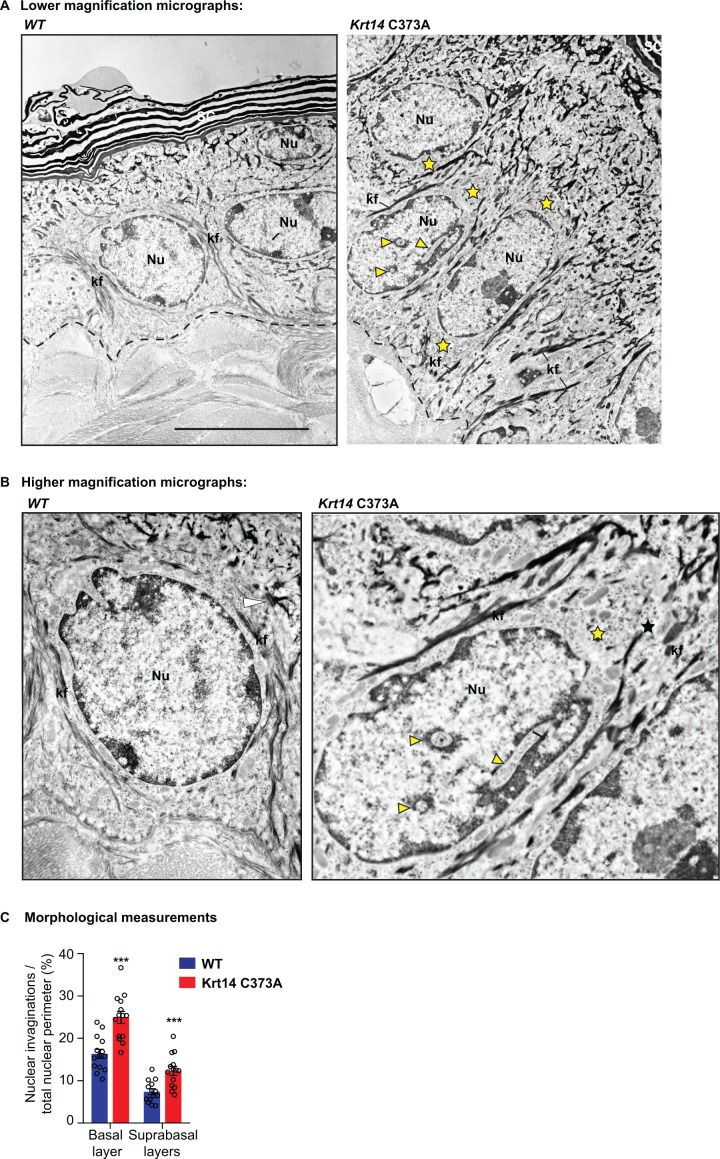
Figure 3—figure supplement 2. Ultrastructural changes and abnormal nuclei in Krt14 C373A keratinocytes.

Figure 3—figure supplement 2.

(A) Transmission electron micrograph of ear skin epidermis from WT and Krt14C373A mice. (B) High magnification images of representative cells in frame a. Dotted lines mark the dermo-epidermal interface. Asterisks depict areas showing abnormal gaps between keratin filaments (kf) and the nucleus (Nu) in mutant Krt14 C373A keratinocytes. Arrowheads depict cytoplasmic invaginations into the nucleus in Krt14 C373A keratinocytes. Scale bar, 5 µm. (C) Quantification of frequency of nuclear invaginations (n = 14 nuclei from two biological replicates for each genotype). Data represent mean ± SEM. Student’s t test: ***p<0.005.