. 2020 May 5;9:e53165. doi: 10.7554/eLife.53165

Figure 4. 14-3-3σ interacts with K14, and abnormal localization 14-3-3σ and YAP in Krt14 C373A epidermis.

(A) Top nine most abundant non-keratin entries from a mass spectrometry screen for proteins interacting with K14 in WT newborn skin keratinocytes (primary culture,1 mM calcium, 4 days). Spectral counts and known relevance to Hippo signaling are indicated. See Figure 4—figure supplement 1 for full listing. (B) Immunoprecipitation of K14 from WT or Krt14 C373A skin keratinocytes in primary culture. Both K14 WT and, albeit to a lesser extent, the 373A mutant interact with HA-tagged 14-3-3σ. KDa, kilodalton. (C) Indirect immunofluorescence for 14-3-3σ in WT and Krt14 C373A tail skin sections. Dashed lines depict the dermo-epidermal interface. (D) Indirect immunofluorescence for YAP in WT and Krt14 C373A tail skin sections. (E) Relative mRNA levels (qRT-PCR) for YAP target genes Ccn1, Zeb1, Ccn2, and Snail2 in adult WT and Krt14 C373A tail skin. N = 3 biological replicates per genotype. (F) Immunoblotting analysis for total YAP and YAPSer127 in WT and Krt14 C373A tail skin protein lysates. (G) Quantification of relative protein levels shown in frame d. Data are mean ± SEM from three biological replicates. Student’s t test: *p<0.05; **p<0.01; ***p<0.005; n.s., no statistical difference. Scale bars, 20 µm.

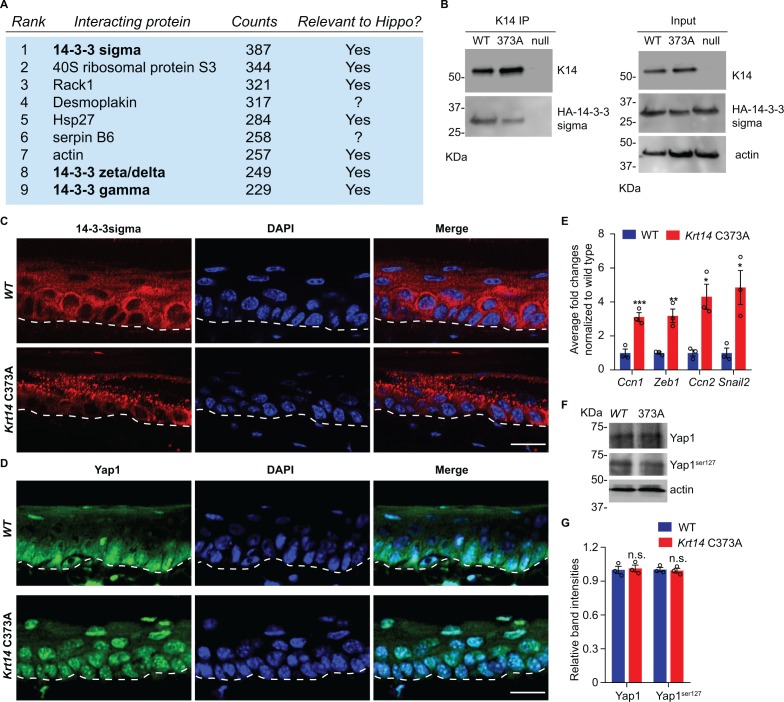
Figure 4.

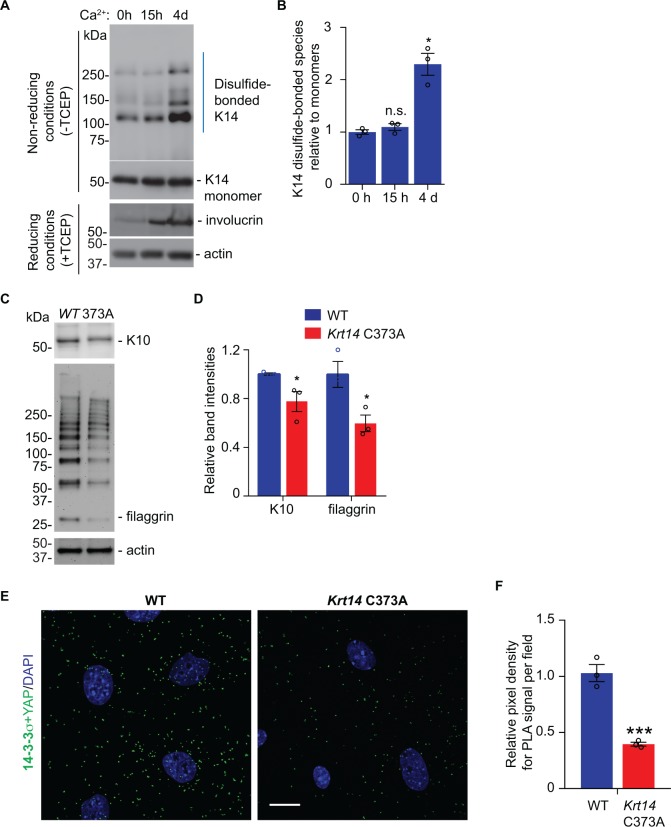
Figure 4—figure supplement 1. Additional analyses of newborn skin keratinocytes in primary culture.

Figure 4—figure supplement 1.

(A) Western blot analysis of total protein extracts from WT newborn keratinocytes in primary culture, in the absence (0 hr) and presence of calcium for 15 hr and 4 days (4d) after addition of calcium. Gels were run is the absence or presence of TCEP reduction as indicated at left. This analysis shows the kinetics of formation of K14-dependent disulfide species after adding calcium. Involucrin is shown as a marker of terminal keratinocyte differentiation; actin is used as a loading control. (B) Quantification (gel scanning densitometry) of the gel data shown in frame A. Data represent mean ± SEM from N = 3 biological replicates. (C) Western blot analysis comparing the steady state levels of K10 and filaggrin at 4 days after adding calcium to primary cultures of WT and Krt14 C373A newborn keratinocytes in primary culture. Filaggrin presents as a gallery of discrete size products consistent with its modular repeat substructure. (D) Quantification (gel scanning densitometry) of the gel data shown in frame C. Data represent mean ± SEM from N = 3 biological replicates. (E) Proximity ligation assays (PLA) for 14-3-3σ and YAP1 in WT and Krt14 C373A newborn keratinocytes in primary cultures subjected to 1 mM calcium-induced differentiation for 4 days. Bar = 20 µm. Nuclei are stained with DAPI (blue). (F) Quantitation of the data shown in frame E. N = 42 cell we counted for each genotype. Data represent mean ± SEM. Student’s t test: ***p<0.005; n.s., no difference.