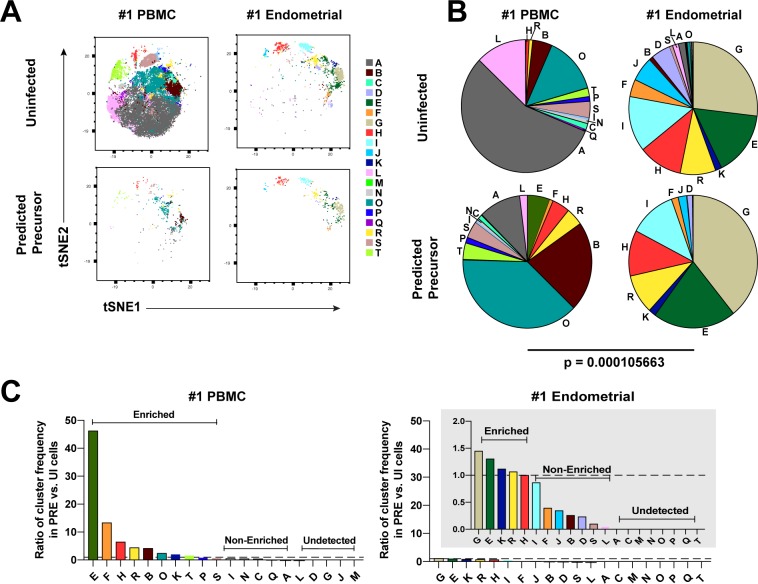
Figure 3. Most subsets of Tm in endometrium but not blood are susceptible to HIV infection.
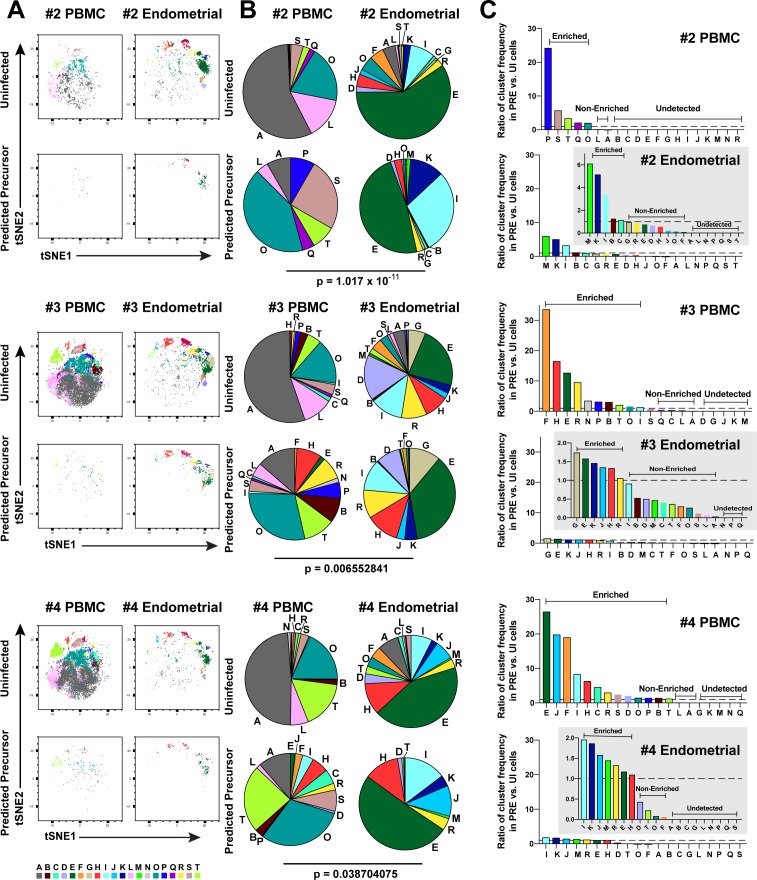
(A) Tm and PRE cells from the blood and endometrium of Donor 1 were analyzed by FlowSOM, which identified 20 clusters of cells (A – T), each depicted with a different color. Note the pattern of uninfected Tm is different from that of the PRE cells for PBMCs, but similar for the endometrium. (B) Pie charts showing proportion of each cluster in the uninfected and PRE cells from PBMCs and ETs. Small clusters with frequencies less than 1% are not depicted. The patterns of clusters in Tm and PRE cells from ETs match more closely than those from PBMCs. Chi-square goodness of fit tests for checking similarity in the distribution of clusters among the Tm and the PRE populations was calculated and the difference in this chi-square dissimilarity metric between the PBMC versus ET datasets is reported as a P-value using procedures detailed in Materials and Methods. (C) PRE cells from PBMCs are more enriched for specific clusters than PRE cells from endometrium. To determine whether PRE cells preferentially resided within any of the clusters, the frequency of each PRE cluster was divided by the frequency of the equivalent cluster among uninfected Tm cells (see Materials and Methods). Ratios > 1 indicate clusters that are enriched in PRE cells relative to uninfected Tm cells. Note the extent of enrichment, as reflected by the ratio values, was more pronounced in PBMCs (left) relative to the endometrium (right). The grey inset is a zoomed-in view of the endometrium data. Corresponding data for the remaining 3 donors are presented in Figure 3—figure supplement 1.


