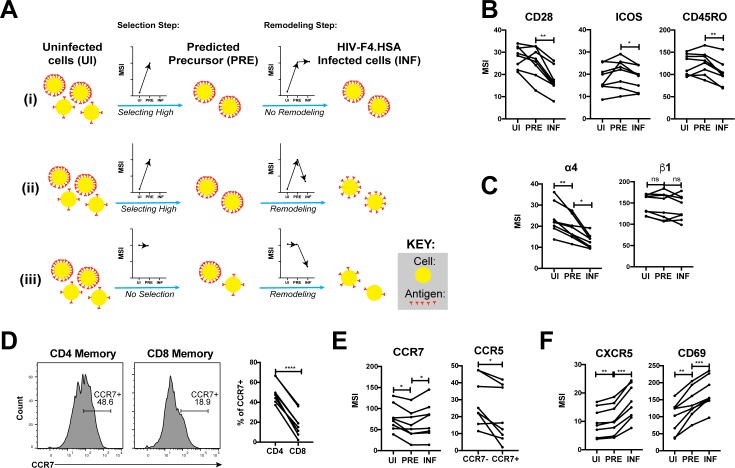
Figure 5. HIV remodels cells to impair TCR signaling and promote migration of infected cells to lymph node follicles.
(A) Schematic of the use of PP-SLIDE to distinguish HIV-induced up- or down-regulation of an antigen from preferential infection of cells expressing higher or lower levels of the antigen. In this schematic, circles (yellow) correspond to individual cells expressing different levels of a hypothetical antigen (red). The y-axis of the graph reflects the MSI of the antigen. In scenario (i), HIV preferentially infects cells with high levels of the antigen (as reflected by the MSI being higher on PRE cells than uninfected (UI) cells) and doesn’t modulate antigen levels after infection (as reflected by the MSI being the same on PRE cells and infected (INF) cells). In scenario (ii), HIV preferentially infects cells with high levels of the antigen (as in scenario (i)), but downregulates its expression in infected cells (as reflected by the MSI being lower on INF cells relative to PRE cells). In scenario (iii), HIV preferentially infects cells with overall equivalent levels of the antigen (as reflected by the MSI being the same on PRE cells and UI cells) but then downregulates the antigen in INF cells (as reflected by the MSI being lower on INF cells than PRE cells). (B) F4.HSA downregulates CD28, ICOS, and CD45RO, components of the TCR signaling apparatus. *p<0.05, **p<0.01 as assessed using the Student’s paired t test and adjusted for multiple testing using the Benjamini-Hochberg for FDR. (C) F4.HSA downregulates the α4 component of the α4β1 integrin. *p<0.05, **p<0.01 as assessed using the Student’s paired t test and adjusted for multiple testing using the Benjamini-Hochberg for FDR. (D) CCR7 expression is higher on Tm cells than on memory CD8+ T cells from the endometrium. Left: Histogram plots showing memory T cells gated on CD4 or CD8 as indicated. Right: Summary of data from 8 donors. ****p<0.0001 as assessed using the Student’s paired t test. (E) F4.HSA preferentially infects Tm cells with low levels of CCR7 but then upregulates expression of this receptor. Left: Plot showing MSI of CCR7 on UI, PRE, and INF cells. Right: Plot showing higher levels of expression of the HIV co-receptor CCR5 on CCR7- Tm cells, which provides an explanation for the higher susceptibility of these cells to infection. *p<0.05 as assessed using the Student’s paired t test. (F) F4.HSA upregulates expression of follicle-homing receptor CXCR5 and the lymph node retention marker CD69. **p<0.01, ***p<0.001 as assessed using the Student’s paired t test and adjusted for multiple testing using the Benjamini-Hochberg for FDR.


