. 2020 May 11;9:e52563. doi: 10.7554/eLife.52563

Figure 1. A genome-wide screen to identify genes required for PLB-985 cells differentiation and function.

(a–d) Characterization of PLB-985 differentiation and function at d0, d3 and 7 of differentiation. (a) Electron microscopy images of PLB-985 showing acquisition of granules (green arrows, the black arrow at d0 indicates mitochondria) and changes in nuclear morphology. Scale bars correspond to 5 μm. (b) ROS production of PLB-985 in response to 100 nM PMA, showing that only fully differentiated PLB-985 produced an oxidative burst. (c) Surface expression of CD11b, depicted is the percentage of CD11b positive cells out of all viable singlets. (d) PMA-induced cell death was measured over time after addition of the cell-impermeable DNA dye SYTOX Green and analysis of fluorescence indicating cell death. ‘d7 naïve’ indicates differentiated cells, which were not treated with PMA. (e) Representative images of differentiated PLB-985 (d7) after addition of SYTOX Green and treatment with or without PMA. Scale bars are 20 μm. (f) Outline of the CRISPR/Cas9 screen. Cells were transduced with a genome-wide CRISPR/Cas9 library (lentiviral particles, small circles), differentiated for 7 days, treated with PMA for 16 hr and survivors were sorted and sequenced to identify sgRNAs. (g) Top 10 of the screen, H1.2 (HIST1H1C) and indicated genes with known neutrophil functions, ranked first by % of overrepresented guides and then by median overrepresentation and mapped to a proteome list of human primary neutrophils. (b–d) Depicted are mean -/+ SEM of 3 independent experiments.

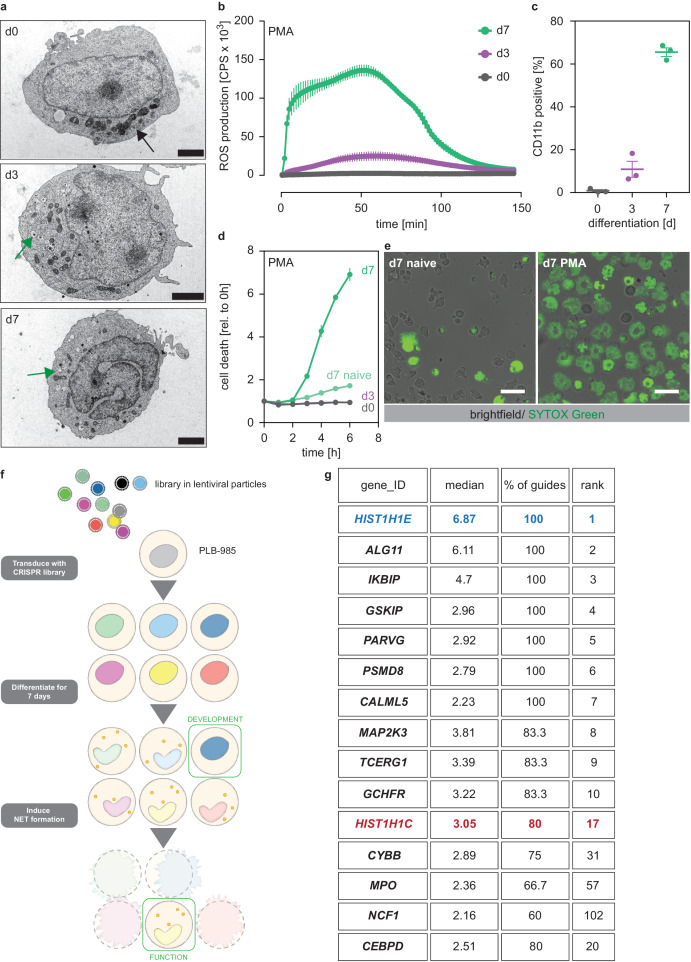
Figure 1—source data 1. List of genes identified as hits in the CRISPR/Cas9 screen.
The table shows gene ID and the fold representation of identified sgRNAs in PMA-treated versus untreated PLB-985. sgRNAS that were not identified in either sample are labelled as NA. The table also shows the median and mean values per gene and the percentage of overrepresented (at least two fold) sgRNAs.

Figure 1.

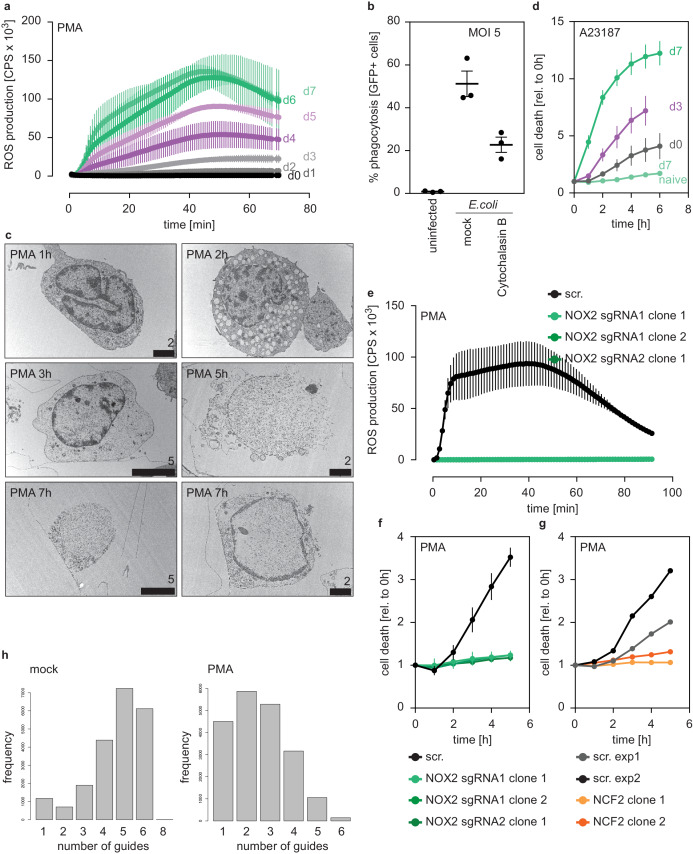
Figure 1—figure supplement 1. Characterization of PLB-985 function and morphology.

Figure 1—figure supplement 1.

(a) ROS production of PLB-985 in response to PMA at different time points of differentiation, depicted are mean -/+ SEM of two independent experiments. (b) Phagocytosis assay of differentiated (d7) PLB-985 incubated with GFP-expressing E. coli (multiplicity of infection (MOI): 5), phagocytosis was analyzed by flow cytometry of GFP-positive cells. The phagocytosis inhibitor cytochalasin B (Sigma, 5 μM) was used as a control. (c) Transmission electron microscopy (TEM) images of differentiated PLB-985 (d7) stimulated with PMA for the indicated time points, demonstrating nuclear expansion and, in some cases (5 hr example), nuclear rupture and chromatin release. Scale bars correspond to indicated values in μm. (d) Cell death in response to the calcium ionophore A23187 (5 μM) at different time points of differentiation, measured by SYTOX Green fluorescence. Depicted are mean -/+ SEM of 3 independent experiments, ‘d7 naive’ are differentiated, but untreated cells and are the same values as in Figure 1d. (e) ROS production of independent NOX2 (CYBB) - / - clones (derived from two sgRNAs) after treatment with PMA. (f) Cell death of independent NOX2 - / - clones (derived from two sgRNAs) after treatment with PMA. (e, f) depicted is the mean -/+ SEM of 2–3 independent experiments. (g) Reduced cell death of two clones deficient in NCF2 in response to PMA, depicted is the mean of 1 experiment per clone and the scrambled (scr.) controls for the respective experiments. (h) sgRNA distribution of PLB-985 after library transduction and differentiation. The left panel shows all sgRNAs identified in the mock-treated sample and demonstrates that mostly 4–6 sgRNAs per gene were identified, indicating good library coverage. The right panel shows the PMA-treated condition where fewer sgRNAs were identified and a left shift was observed, demonstrating selection pressure.