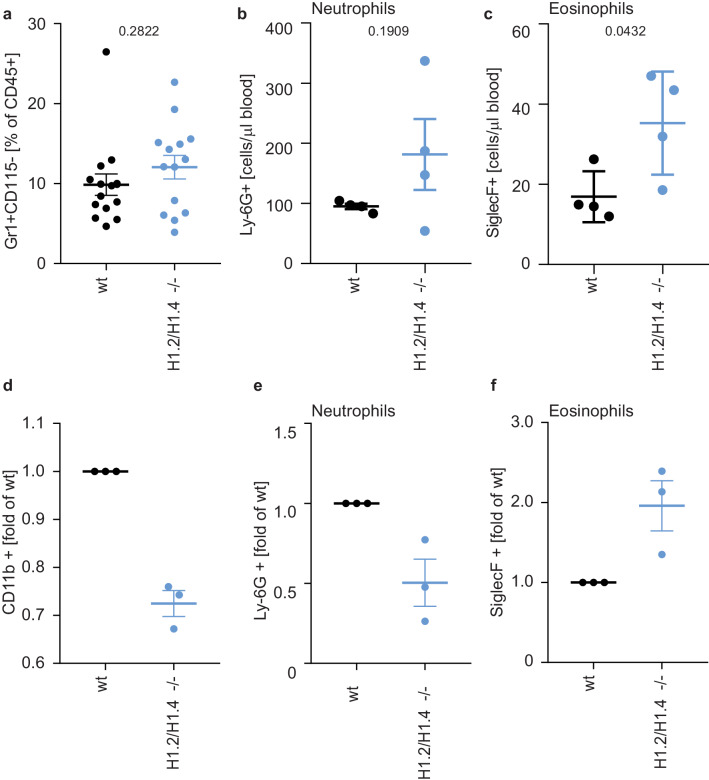
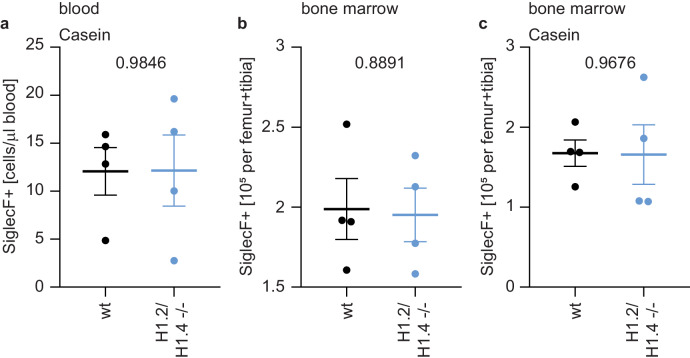
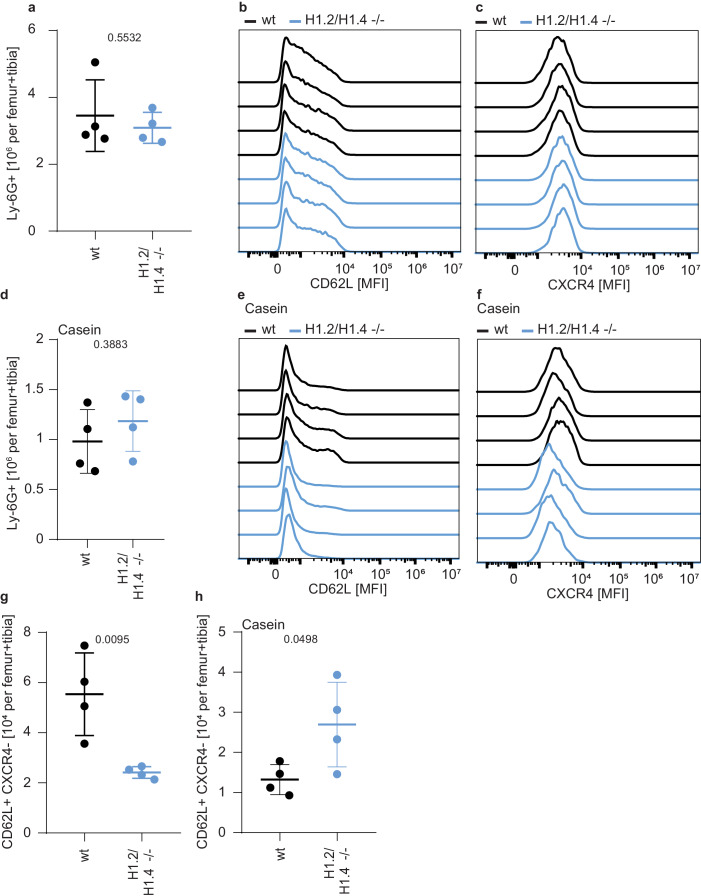
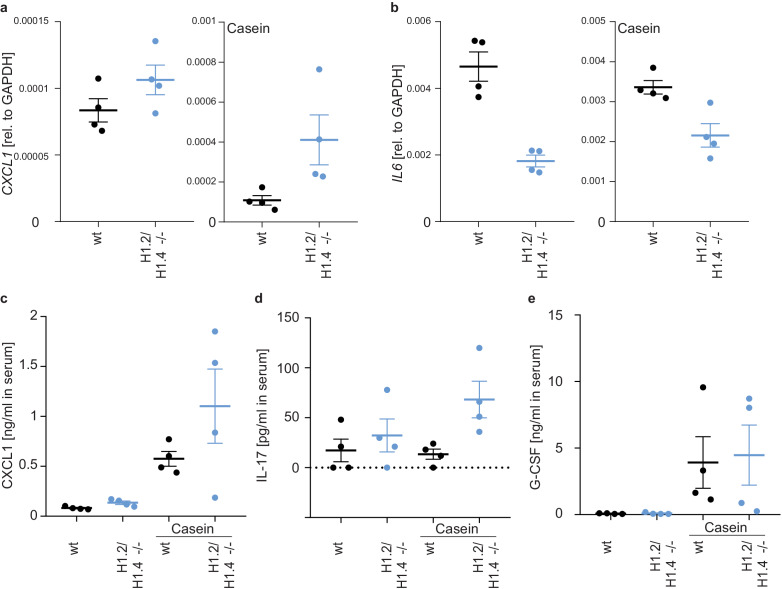
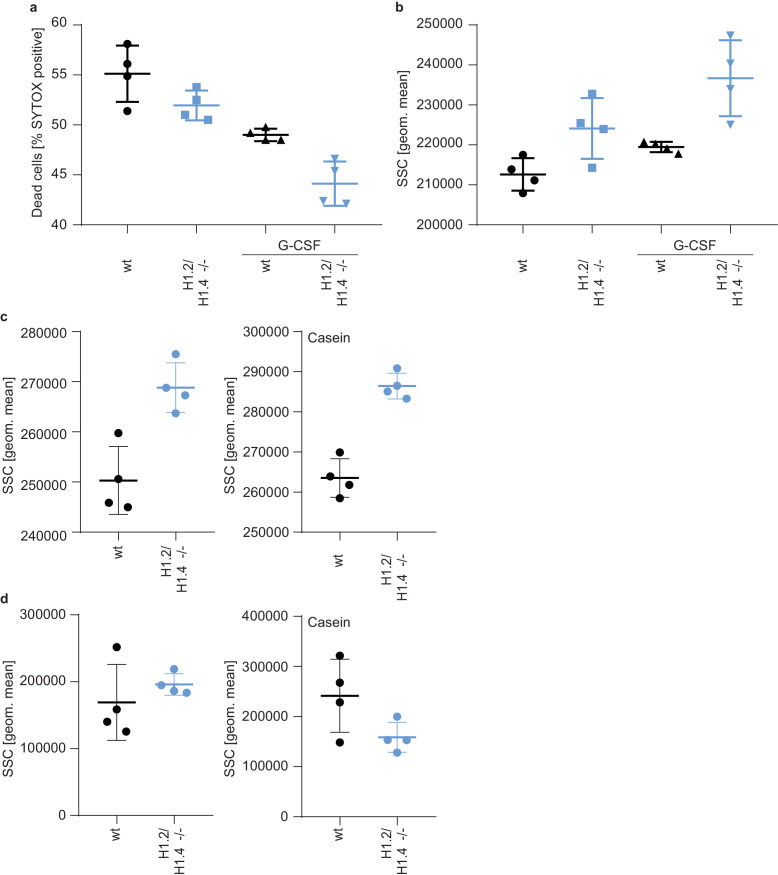
Figure 5. Deletion of H1.2 or H1.4 biases murine hematopoietic cells towards an eosinophil lineage.
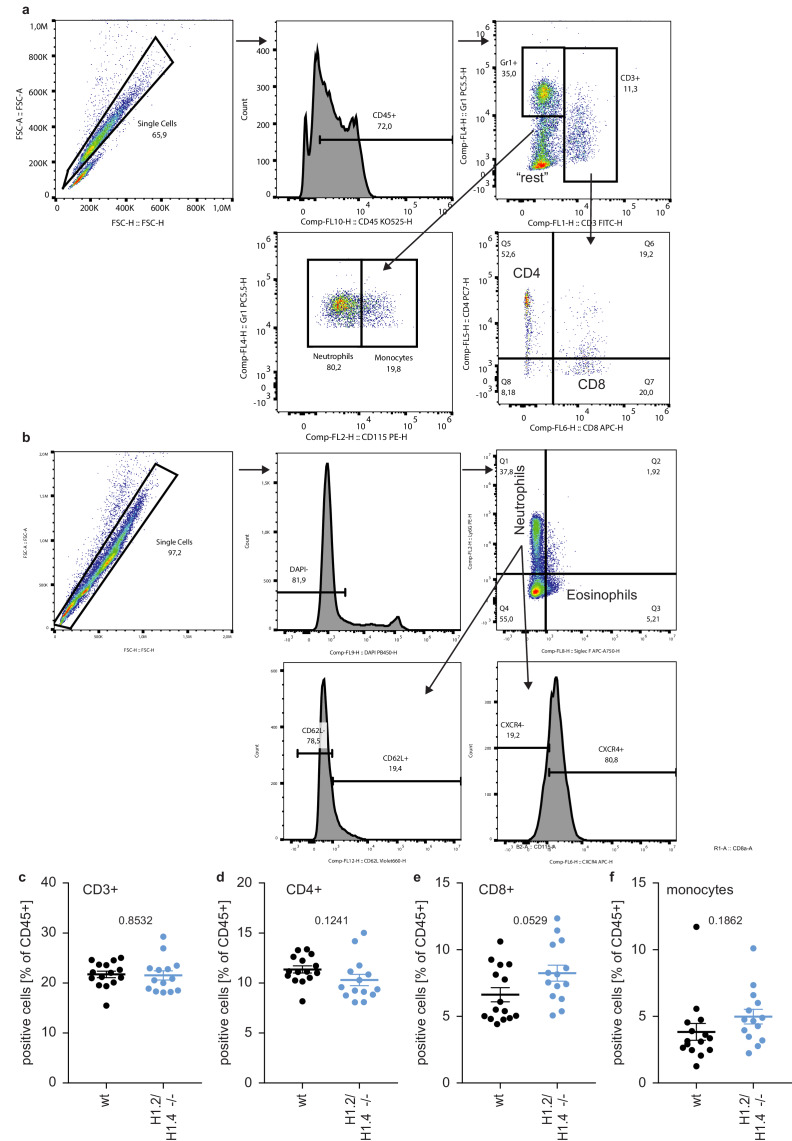
(a–c) Analysis of circulating neutrophils and eosinophils in wild type (wt) and H1.2/H1.4-double deficient mice (H1.2/H1.4 -/-). p Values, derived from unpaired two-tailed T tests, are indicated. (a) Flow cytometry analysis of neutrophils (Gr1 positive, CD115 negative) in whole blood of adult age-matched animals (wt n = 15, H1.2/H1.4 - / - n = 14), other immune cell types are shown in Figure 5—figure supplement 1. (b) Flow cytometry analysis of absolute amounts of neutrophils (Ly-6G positive cells) in whole blood (n = 4). (c) Flow cytometry analysis of amounts of eosinophils (SiglecF positive) in whole blood (n = 4). H1.2/H1.4 - / - animals show enhanced eosinophil numbers in circulation. d-f Lineage-negative hematopoietic stem cells were sorted from murine bone marrow and cultured for 6 days in the presence of various cytokines allowing differentiation into several immune cell lineages. Depicted are CD11b positive cells (d) and the fraction of neutrophils (e) or eosinophils (f) within CD11b-positive cells. Each dot represents an independent experiment consisting of two mice per genotype, the mean of the two wild type animals was set to one and the mean of the two H1.2/H1.4 - / - animals is depicted relative to wt. (a–f) Error bars are SEM.

